

On June 17, 2026, the US Federal Reserve published the Fed dot plot. It showed a dispersion of 2026 and 2027 fed funds rate projections, with greater consensus of rates moving lower toward 3% over the long term. The yearend 2026 median range of the fed funds rate was 3.75% to 4.00%, a quarter-point higher than the current fed funds range of 3.50% to 3.75%.
This fixed income blog post discusses the June 2026 Fed dot plot, its impact on money market yields and other investments, and the Fed’s updated economic projections.
We show in Figure 1a below how money market yields move in lockstep with the fed funds rate. We expect the Vanguard VMFXX 7 day yield of 3.57% to fall slightly over the long term should the Fed’s longer-run low-3% fed funds projection take hold.
There is a significant opportunity cost of holding money market funds. As of 3:47pm EDT on June 17, 2026, there were 15 Apple bonds with yields to maturity of at least 5.50% available on Fidelity.com and other online bond investing platforms.
Bondsavvy’s active bond investment strategy seeks to achieve corporate bond returns that exceed a bond’s purchase date YTM.
The June 2026 Fed Dot Plot
The Fed dot plot shows the projected yearend target range for the fed funds rate from each of the FOMC meeting
participants. Each dot represents the opinion of one FOMC participant. There are typically 19 participants (the 7 Fed governors plus 12 Federal Reserve Bank presidents); however, the June 2026 Fed dot plot included 18 dots for 2026, 2027, and the “Longer Run” and 17 dots for the 2028 projection. During his June 17, 2026 press conference, new Fed chair Kevin Warsh indicated he did not provide a dot on the dot plot, though he encouraged his colleagues to do so.
As shown in Figure 1, nine meeting participants projected the yearend 2026 fed funds target range to be at or below the current 3.50% to 3.75% level. The Fed left the fed funds rate unchanged today. Its last rate cut occurred in December 2025, when the Fed lowered the fed funds rate to its current level. For yearend 2026, three meeting participants projected one quarter-point rate hike and five projected a half-point of rate hikes.
Figure 1: June 2026 Fed Dot Plot Showing Projected Target Range of Fed Funds Rate

Source: June 17, 2026 FOMC Summary of Economic Projections and Bondsavvy calculations.
The dispersion of projections continued into yearend 2027, with five FOMC meeting participants projecting a 3.75% to 4.00% fed funds rate, the largest concentration of dots for that year. Three dots were above this range and 10 were below it.
While high-to-low dispersion of about one percentage point continued in 2028 and beyond, there appeared to be broader consensus of the long-term trend of the fed funds rate to be lower over time.
Money Market Yields’ Correlation to the Fed Funds Rate
The $378 billion Vanguard VMFXX is one of the world’s largest money market funds. The VMFXX yield is closely tied to the US federal funds rate.
As the Fed raised the target fed funds rate 5.25 percentage points from March 2022 to July 2023, the VMFXX yield followed suit, as shown in Figure 1a. When the
Fed then lowered the target range of the fed funds rate by 0.5 points on September 18, 2024, the October 1 and
November 1, 2024 VMFXX distributions also fell.
The November 1, 2024 VMFXX dividend fell 0.50 points from 5.30% on
August 1, 2024 to 4.80% on November 1, 2024. As shown in Figure 1a, the VMFXX monthly distribution yield has fallen 175 basis points from 5.30% on February 1, 2024 to 3.55% on June 1,
2026.
This yield is variable and will change over time. Given the close correlation between the fed funds rate and the VMFXX
yield, the VMFXX yield would fall to the low-3s beyond 2028 should fed funds rate projections take hold.
Figure 1a: VMFXX Distribution Yield vs. Effective Fed Funds Rate (“EFFR”) — March 1, 2022-June 1,
2026
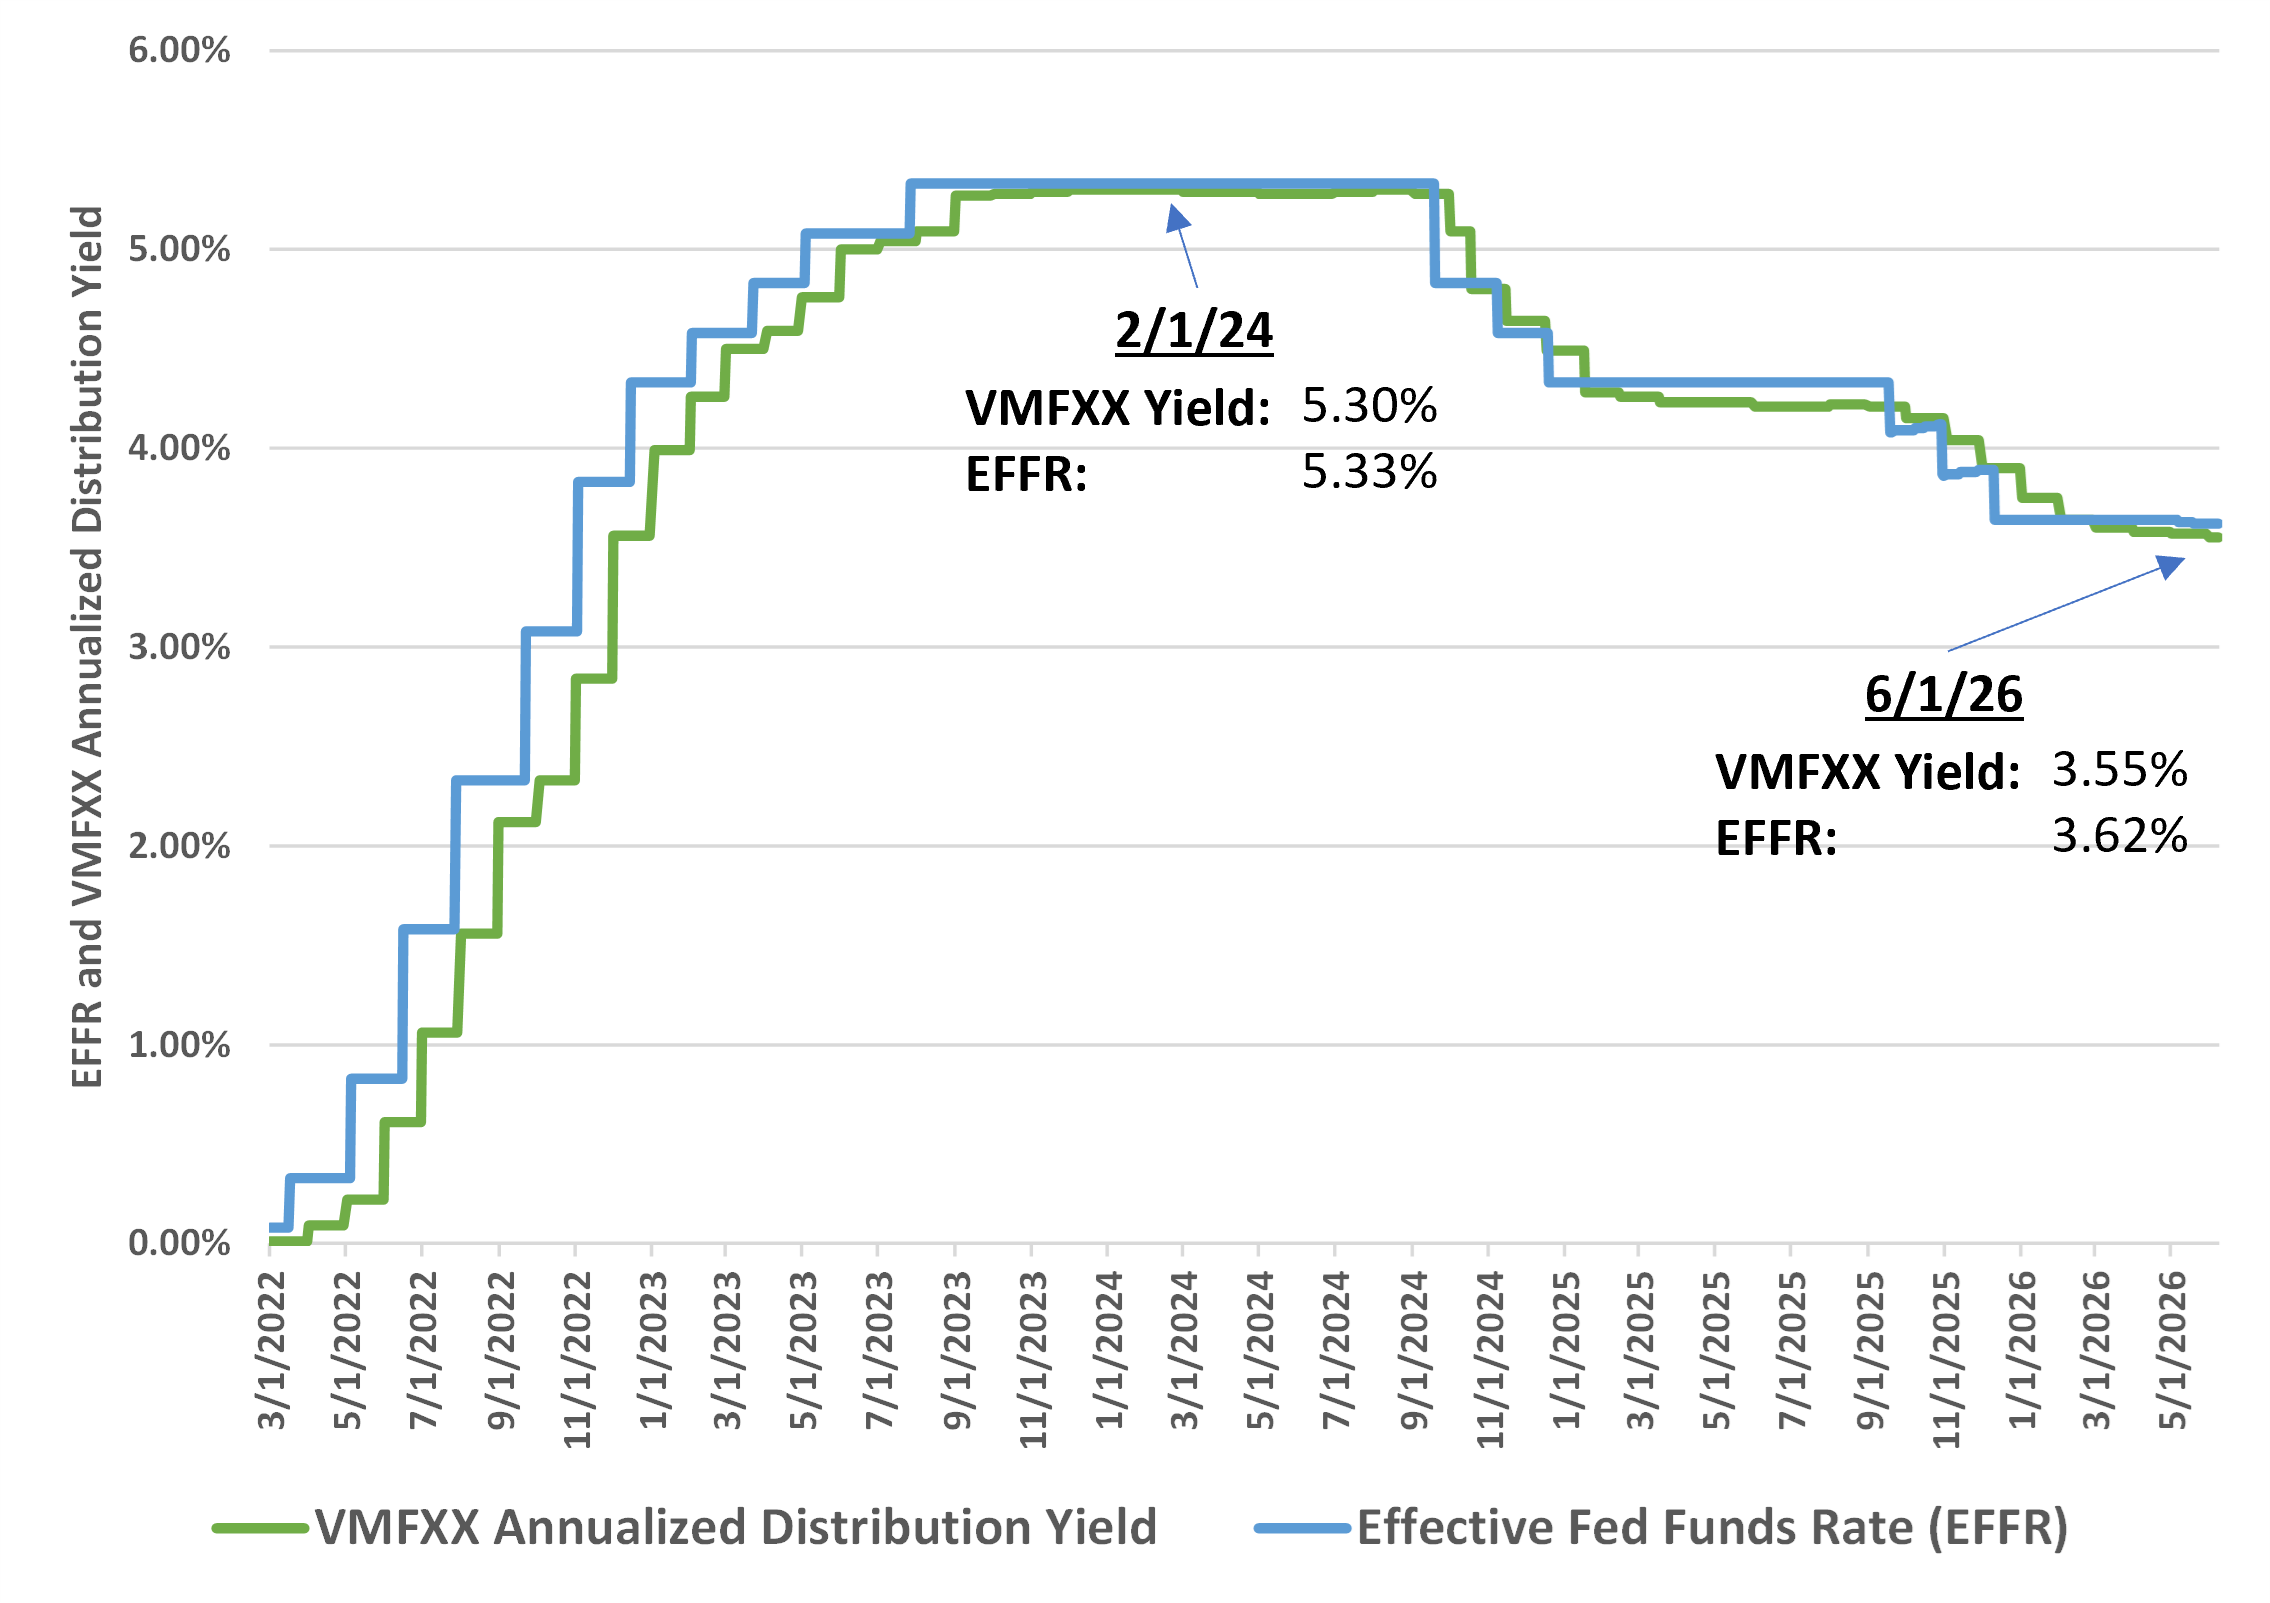
Sources: Vanguard.com and the Federal Reserve Bank of New York data charted by Bondsavvy.
Not only would reductions in the fed funds rate lower the VMFXX yield, but also VMFXX investors would not benefit
from any bond price increases potentially driven by lower interest rates.
The FOMC Press Conference June 17, 2026
On June 17, 2026, new Fed Chair Kevin Warsh hosted a press conference after the FOMC released its 2:00pm Eastern Time
statement that it would be holding the target range of the fed funds rate at 3.50% to 3.75%. Figure A shows key
takeaways, which included the FOMC’s views on current economic conditions,
including growth and inflation.
Figure A: Key Takeaways from the FOMC Press Conference on June 17, 2026

Image licensed from Alamy.

Bondsavvy Subscriber Benefit
Steve Shaw founded Bondsavvy in 2017 to make bond investing simpler and more profitable for individual investors. Our corporate bond recommendations cut through the clutter to identify bonds that
offer high total return opportunities relative to their risk.
The Kevin Warsh Factor
Kevin Warsh was sworn in as the new Fed chairman on May 22. From today’s FOMC press conference, change and reform are on the way. Warsh appears to favor a “less is more” approach when it comes to Fed communication. For example, today’s Federal Reserve press release announcing the Fed’s rate decision was a mere 130 words, about two-thirds shorter than the April 29 Fed statement.
There was also more definitive language around achieving certain goals:
June 17 Fed statement: “The Committee will deliver price stability.”
April 29 Fed statement: “The Committee is strongly committed to supporting maximum employment and returning inflation to its 2 percent objective.”
Warsh was very complimentary of his colleagues on the FOMC, indicating that there was vigorous and healthy debate across the last two days of FOMC meetings. For the five task forces mentioned in Figure A above, Warsh appears to be reaching out to both in-house and non-Fed experts. We eagerly await the establishment of these working groups and their recommendations, which are expected by yearend.
Summary of Last Three Fed Dot Plots
Figure 1b compares the median levels for fed funds rate changes and the fed funds target range across the last three Fed
dot plots. As shown, the biggest difference between the June 2026 Fed dot plot and those prior is the quarter-point rate increase projected for 2026 compared to quarter-point decreases in the previous two Fed dot plots. Our recent economic newsletter article shows the impact prior Fed rate cuts
have had on US Treasury yields during the three most recent rate-cutting periods.
Figure 1b: Summary of Latest Fed Dot Plots
| 2026 | 2027 | Total Rate Cuts (’26-’27) | |
|---|---|---|---|
| Median Level of Rate Changes in Given Year | |||
| June 2026 Fed Dot Plot | +25 bps | -25 bps | None |
| March 2026 Fed Dot Plot | -25 bps | -25 bps | -50 bps |
| December 2025 Fed Dot Plot | -25 bps | -25 bps | -50 bps |
| Median Yearend Fed Funds Target Range | |||
| June 2026 Fed Dot Plot | 3.75%-4.00% | 3.50%-3.75% | |
| March 2026 Fed Dot Plot | 3.25%-3.50% | 3.00%-3.25% | |
| December 2025 Fed Dot Plot | 3.25%-3.50% | 3.00%-3.25% |
Sources: FOMC Summary of Economic Projections Reports and Bondsavvy analysis.
June 2026 Summary of Economic Projections
In connection with creating the Fed dot plot, FOMC participants project key US economic data points, including
unemployment, inflation, and GDP growth. Figure 2 provides a summary of the projections across recent Fed Summaries of Economic Projections (“SEPs”).
As shown, compared to the previous SEP, the June 2026 SEP showed a 0.9-point increase in projected yearend 2026 PCE inflation (to 3.6%) and a 20-basis-point decrease in 2026 real GDP growth (to 2.2%). The increased inflation forecast was on top of a 0.3-point increase between the December 2025 and March 2026 SEPs.
Figure 2: Median Economic Projections of FOMC Participants
| Date of Projection | 2026 | 2027 | Longer Run |
| Unemployment Rate | |||
| June 2026 | 4.3% | 4.3% | 4.2% |
| March 2026 | 4.4% | 4.3% | 4.2% |
| December 2025 | 4.4% | 4.2% | 4.2% |
| September 2025 | 4.4% | 4.3% | 4.2% |
| PCE Inflation | |||
| June 2026 | 3.6% | 2.3% | 2.0% |
| March 2026 | 2.7% | 2.2% | 2.0% |
| December 2025 | 2.4% | 2.1% | 2.0% |
| September 2025 | 2.6% | 2.1% | 2.0% |
| Change in Real GDP | |||
| June 2026 | 2.2% | 2.3% | 2.0% |
| March 2026 | 2.4% | 2.3% | 2.0% |
| December 2025 | 2.3% | 2.0% | 1.8% |
| September 2025 | 1.8% | 1.9% | 1.8% |
Source: FOMC Summary of Economic Projections Reports
How Fed Funds Rate Changes Have Impacted US Treasury Yields
While the US Federal Reserve does not control long-term US Treasury yields, Fed policy and expectations of Fed policy
changes can have a big impact. Figure 2b compares the Effective Fed Funds Rate to the 2-year, 10-year, and 20-year
US Treasury yields. Longer-term Treasury yields impact what homeowners pay for mortgages and the interest rates
companies pay on their debt, resulting in significant impact to economic conditions.
Per Figure 2b, US Treasury yields began increasing in advance of the Fed’s first rate increase in March 2022. As
these yields increased, they converged and had been moving, generally, in similar directions. Treasury yields fell
in late-2023 after reaching a peak in October 2023, but then rose again until spring 2024, as inflation remained
stubborn.
Then, in anticipation of Fed easing, there was a significant decrease in US Treasury yields across the yield curve.
From mid-April to mid-September 2024, the 2-, 10-, and 20-year yields fell 142, 101, and 84 basis points,
respectively. Yields then reversed course again, as September and October 2024 inflation reports came in hot, and
concerns over continued high US budget deficits remained.
Between September 2024 and June 17, 2026, 2-year, 10-year, and 20-year US Treasury yields have risen 64, 86, and 94 basis points, respectively.
Preview our recent economic newsletter
article to see how previous Fed rate cuts impacted bond yields and what this could mean for the path of bond
yields in the future.
Figure 2b: US Treasury Yields vs. Effective Fed Funds Rate — January 4, 2021 to June 17, 2026

Source: US Treasury data as presented by Bondsavvy.
What the Fed Dot Plot Means for Money Market Yields and Other Investments
The expected long-term downward trajectory of the fed funds rate creates advantages for individual corporate
bonds over other investments, such as money market funds and bond funds and ETFs.
Total money market fund assets were $7.9 trillion as of June 10, 2026, up $1.1 trillion from December 2024,
according to Investment Company Institute.
As we discuss in our Eight Reasons Not to Own Vanguard VMFXX
blog post, the VMFXX yield is highly correlated to the fed funds rate. As the fed funds rate falls, the VMFXX yield
would fall as well. In addition, since money market funds such as Vanguard VMFXX cannot achieve capital
appreciation, such investments would not benefit from an increase in bond prices associated with falling interest
rates.
Money market and bond fund distributions vary each month, and investors cannot lock in income the way they can with
individual bonds. In our VMFXX yield blog post, we discuss
how high-quality US corporate bonds have advantages to Vanguard VMFXX, including higher potential returns, lower
fees, and higher credit quality. Individual corporate bonds allow investors to lock in high yields for 5, 10, or 20+
years and to benefit from capital appreciation opportunities. Neither of these key investment objectives is
possible with money market funds.
Bondsavvy has added 27 new recommended corporate bonds to its Premier Service since November 2024, with pick date yields to maturity ranging from 4.72% to over 9.00%. Our active fixed income investment strategy seeks to achieve total investment returns higher than purchase-date YTMs, as we show in our corporate bond returns page. We also recently launched our Bondsavvy Basic service, which provides a smaller number of recommended bonds than the Premier service.
Become a Bondsavvy subscriber to gain immediate access to our current investment recommendations and to be the first to learn our new recommendations on June 25 (Premier Service) and June 30 (Basic Service). We also update our bond recommendations each quarter, and we will update our Premier and Basic bond recommendations in July.