
The Architecture of Risk: How Energy Markets Actually Process Middle East Conflict
Energy markets have always been imperfect processors of geopolitical information. Traders operate under conditions of radical uncertainty, incomplete intelligence, and compressed decision windows. The result is a pricing mechanism that frequently overshoots on fear and undershoots on resolution, creating patterns of oil market volatility in the Middle East that tell us less about physical supply than about collective market psychology. Understanding how this mechanism actually functions, beneath the noise of daily headlines, is the central challenge for anyone tracking energy markets in 2026.
When big ASX news breaks, our subscribers know first
Why Oil Prices No Longer React to Middle East Conflict the Way They Used To
For much of the late twentieth century, Middle East escalation functioned as a near-automatic oil price trigger. The logic was straightforward: the region dominated global production, and any disruption carried obvious supply consequences. That mechanical relationship has eroded substantially, though it has not disappeared entirely.
Three structural forces now act as meaningful buffers against generalised conflict risk:
- Non-OPEC supply growth, particularly from U.S. shale, Canadian oil sands, and Norwegian offshore operations, has reduced the world’s dependence on any single producing region.
- Softening demand trajectories across developed economies, driven by electrification, efficiency improvements, and structural industrial change, have reduced the marginal impact of supply shocks.
- Significant OPEC+ spare capacity, concentrated primarily in Saudi Arabia at an estimated 2 to 3 million barrels per day under normal conditions, provides a buffer that did not exist in earlier conflict cycles.
Yet the market remains acutely sensitive to specific threat categories. The analytical distinction that now matters is not whether conflict exists, but whether it credibly threatens irreplaceable infrastructure nodes: chokepoints, primary export terminals, and refining capacity. Political noise produces temporary price spikes. Physical disruption produces durable ones. Understanding oil price movements in this context requires separating these two distinct categories of risk.
What the Market Is Actually Pricing
Contemporary energy traders are not pricing Middle East tension as a monolithic risk category. They are, furthermore, pricing specific threat vectors with precision. Threats targeting the Strait of Hormuz generate a different market response than threats targeting onshore production facilities, which generate a different response again to threats aimed at refining capacity.
The speed of price reversals has increased dramatically. Large intraday swings have become routine as diplomatic signals and military escalations alternate within hours. This compression of the escalation-de-escalation cycle has transformed oil into something approaching a real-time referendum on geopolitical communication, including statements from heads of state delivered via social media platforms, rather than a pure supply and demand instrument.
The gap between headline escalation and actual physical disruption is where most of the mispricing occurs. Understanding this gap is the central analytical challenge for energy market participants navigating the current environment.
The Strait of Hormuz: Why One Waterway Holds the Global Energy System Hostage
Anatomy of the World’s Most Critical Oil Chokepoint
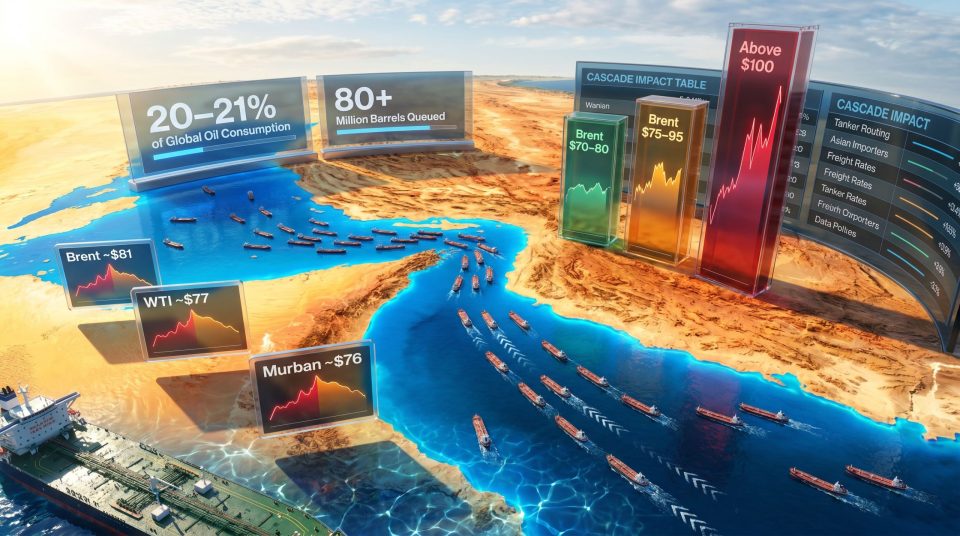
The Strait of Hormuz is the transit corridor for approximately 20 to 21% of global oil consumption, making it the single most consequential maritime bottleneck in the global energy system. Any credible threat to passage through Hormuz triggers immediate repricing across Brent, WTI, and regional benchmarks including Murban and Dubai crude.
Recent events illustrated this with particular clarity. More than 80 million barrels of crude queued for exit as transit uncertainty mounted during the peak escalation period, only for prices to reverse sharply when diplomatic signals emerged. The speed of both the initial reaction and the reversal captured the volatility regime that now characterises this market. The geopolitical risk landscape surrounding Hormuz, consequently, remains one of the most closely monitored variables in global energy pricing.
How Hormuz Disruption Cascades Through Global Supply Chains
| Impact Category | Short-Term Effect | Medium-Term Effect |
|---|---|---|
| Tanker routing | Vessels reverse course or anchor | Alternative route premiums spike |
| Asian importers | Emergency reserve drawdowns | Accelerated supply diversification |
| European markets | Spot price volatility | LNG arbitrage windows open |
| Benchmark spreads | Brent-WTI differential widens | Regional grade discounts emerge |
| Freight rates | Tanker rates surge sharply | Longer voyage economics reshape trade flows |
Why Hormuz Traffic May Never Fully Normalise
Goldman Sachs has flagged a concern that extends well beyond the immediate crisis: even after Hormuz physically reopens, behavioural changes among shippers, insurers, and importers create lasting structural shifts that pure supply restoration cannot undo. War-risk insurance premiums remain elevated long after active hostilities cease, adding a persistent cost layer to Persian Gulf trade flows.
The behavioural dimension is particularly visible in India’s response. Despite Hormuz reopening and India receiving its first post-deal LNG cargo through the strait, Indian refiners have demonstrated meaningful reluctance to immediately revert to Middle Eastern supply patterns. This signals a permanent recalibration of procurement strategy rather than a temporary disruption response, with lasting implications for regional crude grade pricing and trade flow geography.
What Drives Intraday Oil Price Swings During Middle East Escalation?
The Three-Layer Volatility Framework
Understanding oil price behaviour during active conflict requires separating three distinct response layers that operate on different timescales.
Layer 1: Headline Risk (Minutes to Hours)
Social media statements, military announcements, and diplomatic signals produce immediate algorithmic trading responses. Price moves of 2 to 4% within single sessions are now common during active escalation cycles. When threats targeting Kharg Island, Iran’s primary crude export terminal responsible for the overwhelming majority of Iranian crude exports, emerged during the recent escalation, prices moved sharply higher before a subsequent diplomatic reversal collapsed the move within the same trading day.
Layer 2: Physical Supply Assessment (Hours to Days)
Markets recalibrate once analysts assess whether actual production, refining, or transit capacity has been impaired. When attacks or threats remain contained to political posturing without infrastructure damage, prices tend to retrace rapidly. When refining capacity or export terminals are physically affected, however, price support becomes more durable and the retrace is slower.
Layer 3: Structural Repositioning (Weeks to Months)
Sustained conflict reshapes procurement patterns, strategic reserve policies, and long-term supply contracts. India’s decision to order a major strategic oil reserve expansion following the supply disruption period is a direct example of this structural response layer activating. This process takes quarters to complete, not days, and its effects persist long after the immediate conflict de-escalates.
Is OPEC’s Spare Capacity Enough to Absorb a Major Middle East Disruption?
The Spare Capacity Buffer and Its Real Limitations
Saudi Arabia holds the largest share of OPEC’s available spare capacity, estimated at 2 to 3 million barrels per day under normal operating conditions. Kuwait has signalled the ability to ramp output toward 2 million barrels per day within days under emergency conditions, adding a meaningful secondary buffer. The broader OPEC market influence on price stability, furthermore, depends heavily on how quickly this capacity can be mobilised in practice.
However, spare capacity carries important constraints that market commentary frequently underweights:
- Deployment speed is limited. Bringing spare capacity online takes days to weeks, not hours, meaning it cannot cushion the initial price spike from a sudden disruption.
- Transit dependency means that even fully deployed spare capacity cannot compensate if the transit infrastructure carrying that additional supply is itself compromised.
- Grade specificity matters. Not all spare capacity produces crude grades that are interchangeable with disrupted supplies, creating refinery configuration mismatches in importing nations.
The Kharg Island Scenario: Asymmetric Risk in Practice
Kharg Island processes the vast majority of Iran’s crude exports. A credible threat to this single facility represents a disproportionate supply shock relative to its geographic footprint. Even a temporary disruption to Kharg would remove a meaningful volume from global markets that OPEC spare capacity cannot immediately replace at equivalent grades and delivery timelines.
The market’s vulnerability is not to broad regional instability. It is to precision disruption of irreplaceable infrastructure nodes. This is the correct analytical framework for assessing geopolitical oil risk in 2026.
How the U.S.-Iran Conflict Cycle Is Reshaping Oil Market Behaviour
From Geopolitical Risk to Real-Time Diplomatic Arbitrage
The U.S.-Iran conflict dynamic has evolved into a pattern where escalation and de-escalation occur within compressed timeframes, forcing markets to reprice multiple times within a single trading session. The sequence of military exchanges, threats against strategic assets, followed by diplomatic overtures and ceasefire signals, has created a new volatility regime that professional energy traders have had to fundamentally adapt to.
Traders have responded by treating each escalation cycle as potentially self-limiting, reducing the duration of risk premiums while increasing the amplitude of intraday moves. The practical effect is that conflict-driven price spikes are sharper but shorter, compressing the window for trading strategies that depend on sustained elevated prices.
The Ceasefire-to-Collapse Pattern and Its Market Implications
Ceasefire agreements during the current conflict cycle have produced sharp price declines. The IEA’s projection of a significant oil surplus by 2027 contingent on Middle East supply normalisation illustrates how dramatically the forward curve shifts based on conflict resolution assumptions. Yet TotalEnergies has assessed that Saudi refinery capacity will not fully recover until 2027, adding a supply-side constraint that complicates the surplus narrative even under optimistic diplomatic scenarios.
According to IEA analysis on Middle East energy markets, the region’s supply dynamics remain central to understanding forward price trajectories, particularly given the pace at which regional infrastructure recovers following sustained conflict.
Key Price Reference Points During Recent Escalation Cycles
| Benchmark | Pre-Escalation Level | Direction During Escalation | Post-Ceasefire Trajectory |
|---|---|---|---|
| Brent Crude | ~$81 | Elevated (conflict premium) | Declining toward $73-75 range |
| WTI Crude | ~$77 | Elevated | Declining toward $70-72 range |
| Murban Crude | ~$76 | Elevated | Falling toward $73 range |
| OPEC Basket | ~$82-83 | Elevated | Declining toward $76-78 range |
The next major ASX story will hit our subscribers first
The Super-Sparta Model and Its Economic Contradictions
Since October 2023, Israel’s defence expenditure has more than doubled, with cumulative war-related costs reaching approximately $138 billion. Public debt has expanded from roughly 60% of GDP to approximately 70%, a significant deterioration for an economy previously regarded as fiscally disciplined. The policy orientation toward permanent military readiness introduces a structural uncertainty premium affecting investment decisions across the region.
Israel’s economic model has historically functioned through a narrow but highly productive base: technology, software, cybersecurity, semiconductors, defence exports, pharmaceuticals, and professional services. A small proportion of the workforce employed in high-value sectors effectively cross-subsidises extensive public services and one of the world’s most sophisticated military establishments.
Israel’s Technology Economy Under Sustained Military Pressure
The technology sector represents approximately one-fifth of Israeli GDP, more than half of total exports, and a disproportionate share of tax revenues. Unlike heavy industrial sectors, technology companies possess high capital mobility: intellectual property, talent, and investment can relocate more readily than physical infrastructure.
Current market signals suggest that investors are pricing a specific end-state scenario rather than the ongoing costs of sustained conflict. The shekel has remained relatively strong, equity markets have stayed elevated, and risk premiums have compressed. This reflects a market consensus that Israel will emerge from the current conflict period with a stronger strategic position and significantly weakened regional adversaries.
The more difficult question, which a growing number of financial analysts are beginning to raise, concerns how long that end-state thesis can sustain investor confidence as the explicit policy orientation shifts toward permanent confrontation rather than discrete campaigns.
The ZIM Shipping Case: When Commercial Assets Become Strategic Infrastructure
Israel’s opposition to the proposed sale of shipping company ZIM to Germany’s Hapag-Lloyd reflects a broader pattern of commercial logistics assets being reclassified as national security infrastructure. ZIM handles a significant portion of Israel’s containerised imports, including food shipments, making it strategically indispensable in a sustained conflict environment. Multiple Israeli ministries have argued that transferring effective control could undermine the country’s ability to secure critical imports under military pressure.
This reclassification of economic assets has direct implications for foreign investment frameworks and M&A activity across the region, signalling that conventional commercial logic now operates within a national security overlay that can override transaction economics.
Lebanon, Saudi Arabia, and the Geopolitical Reconstruction of Regional Trade
How the Ceasefire Economy Is Being Engineered
Saudi Arabia’s decision to lift its five-year ban on Lebanese imports, reinstating a trade relationship previously worth approximately $100 million annually, represents a deliberate economic intervention designed to shift Lebanon’s political orientation. The timing reflects a coordinated approach in which economic relief functions as a complement to Israeli military pressure and U.S. diplomatic efforts aimed at weakening Hezbollah’s institutional hold.
Lebanese political voices have become increasingly vocal about the structural asymmetry of this arrangement: Beirut is effectively being asked to negotiate its political future while Israel continues to conduct airstrikes, occupy territory in the south, and expand its military footprint, including reports of road widening and watchtower construction across southern Lebanon and Syria.
Iraq’s Strategic Pivot: Why the Syria Oil Route Survives Hormuz Normalisation
Iraq’s decision to maintain its alternative Syria-based oil export corridor even as Hormuz reopens signals a permanent strategic diversification away from single-route dependency. This reflects a broader regional pattern accelerated by the Hormuz crisis: pipeline and alternative route investment across the Middle East has intensified, with the crisis functioning as a forcing mechanism for infrastructure investment that was previously deferred.
The long-term implication is a gradual reduction in Hormuz’s systemic leverage over global oil markets, a structural shift with consequences that will extend across multiple decades of energy trade geography. For a broader perspective on how these dynamics interact, the crude oil market overview provides useful context on pricing trends across key benchmarks.
Who Benefits and Who Loses From Middle East Oil Volatility?
Winners in the Current Volatility Regime
- Non-OPEC producers including U.S. shale, Canadian oil sands, and Norwegian offshore operations benefit from price spikes without bearing direct conflict risk.
- Energy trading desks with sophisticated geopolitical risk models capture value from intraday volatility patterns that less specialised participants cannot navigate.
- LNG exporters in Qatar, Australia, and the United States benefit as importers seek supply chain diversification away from pipeline-dependent Middle Eastern sources.
- Alternative route infrastructure owners gain as pipeline capacity through non-Hormuz corridors becomes systematically more valuable.
Losers in the Current Volatility Regime
- Asian importers, particularly India, China, South Korea, and Japan, face elevated costs and supply uncertainty. India’s energy import bill jumped 82% during the peak escalation period, illustrating the fiscal severity of sustained disruption for large net-importing economies.
- European refiners dependent on Middle Eastern crude grades face margin compression and feedstock uncertainty, with the ECB noting that an Iran peace deal will not fully erase Europe’s energy price shock.
- Regional economies including Lebanon, Iraq, and smaller Gulf states experience investment climate deterioration regardless of their proximity to active conflict.
- Tanker operators face short-term rate windfalls but long-term route uncertainty that complicates fleet investment planning and long-term charter economics.
Historical Patterns and the Structural Versus Cyclical Price Framework
The Spike-and-Retrace Pattern: How Long Does It Last?
Historical analysis of Middle East conflict cycles shows that Brent crude typically retraces 60 to 80% of conflict-driven spikes within 30 to 90 days of de-escalation, assuming no permanent infrastructure damage occurs. The 2019 Abqaiq-Khurais attack, which temporarily removed approximately 5% of global supply, saw prices spike sharply and then retrace almost entirely within two weeks as Saudi Arabia demonstrated rapid restoration capacity.
The speed of supply restoration is the primary determinant of how long elevated prices persist. Where restoration is rapid and credible, risk premiums collapse quickly. Where damage is sustained or structural, the price premium duration extends substantially.
Framework for Analysis: Middle East conflict generates two distinct price effects that must be separated analytically. First, cyclical effects, which are temporary risk premiums that dissipate as conflict de-escalates or supply is restored. Second, structural effects, which are permanent changes to trade routes, procurement patterns, insurance frameworks, and infrastructure investment that persist regardless of conflict resolution. The current cycle is generating both simultaneously.
In addition, understanding the trade war oil impact on these dynamics adds another layer of complexity, as tariff regimes and trade restrictions interact with geopolitical risk premiums in ways that further complicate price discovery.
The Forward Outlook: Three Scenarios for Middle East Oil Markets Through 2027
Scenario 1: Diplomatic Normalisation (Base Case)
Ceasefire agreements hold, Hormuz traffic normalises, and Iranian supply gradually returns to market. The IEA projects a significant oil surplus by 2027 under this scenario as Middle Eastern supply recovery coincides with continued non-OPEC production growth. Brent would likely gravitate toward the $70 to $80 range with a reduced volatility premium as the structural uncertainty discount compresses.
Scenario 2: Prolonged Low-Level Conflict (Elevated Uncertainty Case)
Intermittent escalation cycles continue without full resolution, maintaining a persistent risk premium. Infrastructure remains largely intact but trade route diversification accelerates permanently. Brent oscillates in a $75 to $95 range with frequent intraday volatility episodes as each new diplomatic development reshapes forward expectations.
Scenario 3: Major Infrastructure Disruption (Tail Risk Case)
A significant attack on critical production or transit infrastructure causes sustained supply removal. Spare capacity is deployed but cannot fully offset the disruption within the short term, particularly if the affected infrastructure includes Kharg Island or other non-replicable export nodes. Brent could spike well above $100 before gradually retracing as alternative supply sources scale up and emergency strategic reserve releases cushion the initial shock. Oil market volatility in the Middle East, under this scenario, would be severe and sustained.
Frequently Asked Questions: Oil Market Volatility in the Middle East
What Causes Oil Prices to Spike During Middle East Conflicts?
Price spikes occur when traders assess that physical supply through production, refining, or transit disruption is at credible risk. Threats to chokepoints like the Strait of Hormuz or specific export infrastructure like Kharg Island generate the largest reactions because they represent irreplaceable nodes in the global supply chain.
Does Middle East Conflict Always Push Oil Prices Higher?
No. The relationship has weakened significantly due to expanded non-OPEC supply, OPEC+ spare capacity, and softer demand growth in developed economies. Prices can fall sharply even during active conflict if markets assess that physical supply remains intact or that diplomatic resolution is imminent.
How Does the Strait of Hormuz Affect Global Oil Markets?
Approximately 20 to 21% of global oil consumption transits through Hormuz. Any credible disruption triggers immediate repricing across all major benchmarks, elevated tanker rates, and accelerated strategic reserve drawdowns among major importing nations. Research published by Georgetown Journal of International Affairs explores how the new geopolitics of energy informs this ongoing price risk relationship in the Middle East.
Which Countries Are Most Vulnerable to Middle East Oil Volatility?
Large Asian importers, particularly India, China, South Korea, and Japan, face the greatest exposure due to their dependence on Middle Eastern crude. India’s energy import bill surged 82% during peak escalation, illustrating the fiscal severity of sustained supply disruption.
What Is OPEC’s Spare Capacity and Can It Offset a Major Disruption?
Saudi Arabia holds an estimated 2 to 3 million barrels per day of spare capacity, with Kuwait capable of adding approximately 2 million barrels per day under emergency conditions. However, spare capacity cannot be deployed instantaneously and cannot compensate for disrupted transit infrastructure.
How Long Do Oil Price Spikes From Middle East Conflicts Typically Last?
Historical patterns suggest that 60 to 80% of conflict-driven price spikes retrace within 30 to 90 days of de-escalation, assuming no permanent infrastructure damage. The speed of supply restoration is the primary determinant of how long elevated prices persist. This pattern underscores why oil market volatility in the Middle East is best understood through the lens of infrastructure integrity rather than political headlines alone.
Readers seeking additional context on global oil price movements and Middle East energy market developments can explore real-time coverage and analysis at OilPrice.com, which provides ongoing reporting on geopolitical developments affecting energy markets worldwide.
This article is intended for informational and educational purposes only and does not constitute investment advice. Energy market forecasts involve significant uncertainty, and outcomes may differ materially from any scenarios discussed. Readers should conduct independent research and consult qualified financial advisers before making investment decisions.
Want to Stay Ahead of the Next Major Mineral Discovery on the ASX?
While geopolitical volatility reshapes global energy markets, Discovery Alert’s proprietary Discovery IQ model cuts through the complexity by delivering real-time alerts on significant ASX mineral discoveries — instantly translating complex data into actionable opportunities for both short-term traders and long-term investors. Explore how historic discoveries have generated substantial returns on Discovery Alert’s dedicated discoveries page, and begin your 14-day free trial today to position yourself ahead of the broader market.