

Introduction & Market Context
iA Financial Corporation Inc. (TSX:IAG) presented its first quarter 2026 results on May 6, 2026, showcasing strong operational performance even as its stock declined 8.85% on the day to close at $160.42. The Canadian life insurer reported core earnings per share of $3.25, up 12% year-over-year, though reported EPS fell 25% to $1.49 due to market-related impacts totaling $87 million after tax.
President and CEO Denis Ricard and CFO Éric Jobin led the presentation, highlighting record wealth management sales, robust capital generation, and an expanded shareholder return program despite headwinds in certain insurance segments.
Quarterly Performance Highlights
As shown in the following comprehensive overview of the quarter’s key metrics, iA Financial delivered mixed but generally positive results across its core performance indicators.
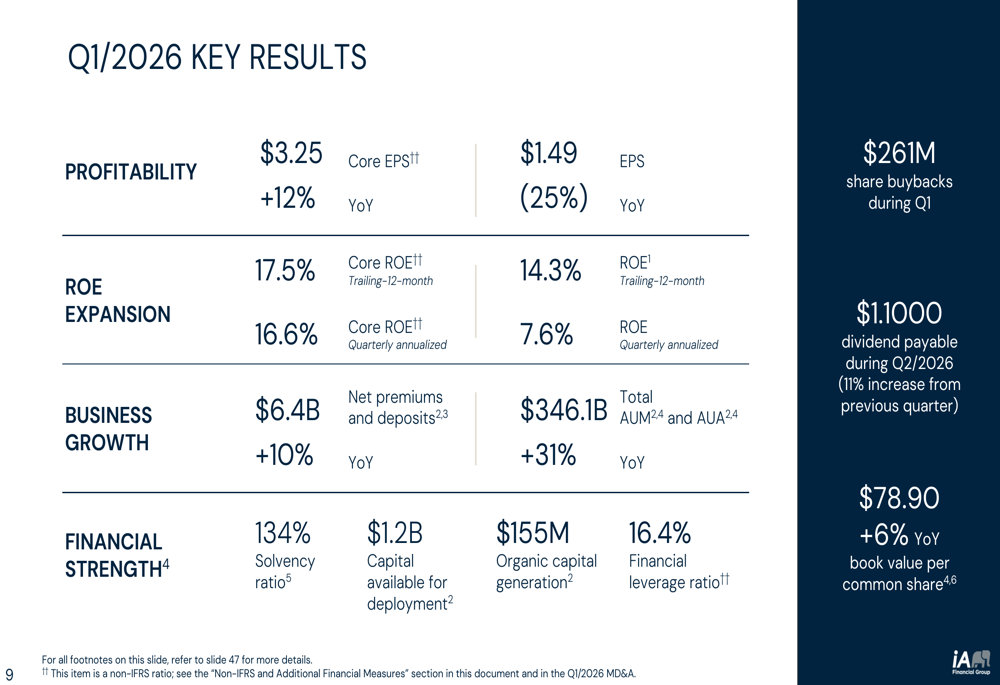
The company’s core return on equity reached 17.5% on a trailing twelve-month basis, exceeding its 2026 target of 17%+. The quarterly annualized core ROE of 16.6% demonstrated the sustainability of profitability despite market volatility. However, reported ROE metrics were significantly lower at 14.3% (trailing) and 7.6% (quarterly annualized) due to non-core market impacts.
Net premiums and deposits grew 10% year-over-year to $6.4 billion, while total assets under management and administration surged 31% to $346.1 billion, reflecting both organic growth and market appreciation. The solvency ratio stood at a healthy 134%, well above the regulatory minimum of 90%, providing substantial financial flexibility.
The company maintained $1.2 billion in capital available for deployment and generated $155 million in organic capital during the quarter. Management announced an 11% quarterly dividend increase to $1.10 per share and expanded its share buyback program from 5% to 8% of public float, deploying $261 million through share repurchases in Q1.
Business Growth Analysis
The wealth management division emerged as the standout performer, as illustrated in the following breakdown of sales across product categories.
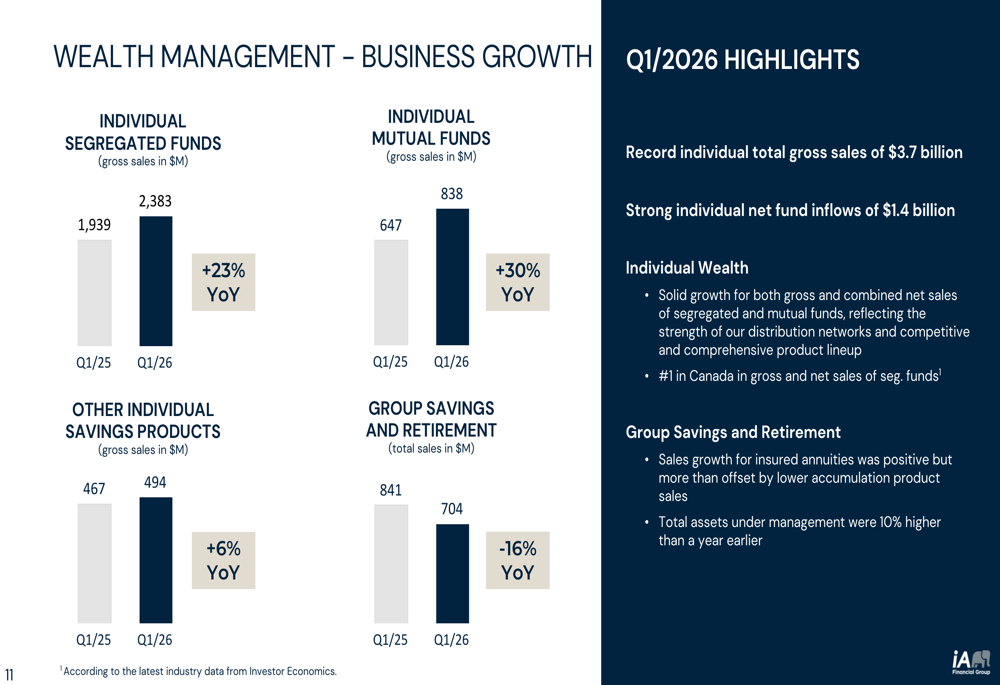
Individual wealth management posted record total gross sales of $3.7 billion, with segregated funds increasing 23% to $2.4 billion and mutual funds up 30% to $838 million. The company claimed the #1 position in Canada for both gross and net sales of segregated funds, generating strong net fund inflows of $1.4 billion. Total assets under management in wealth grew 10% year-over-year.
Canadian insurance operations showed more modest results, as detailed in the following segment performance data.
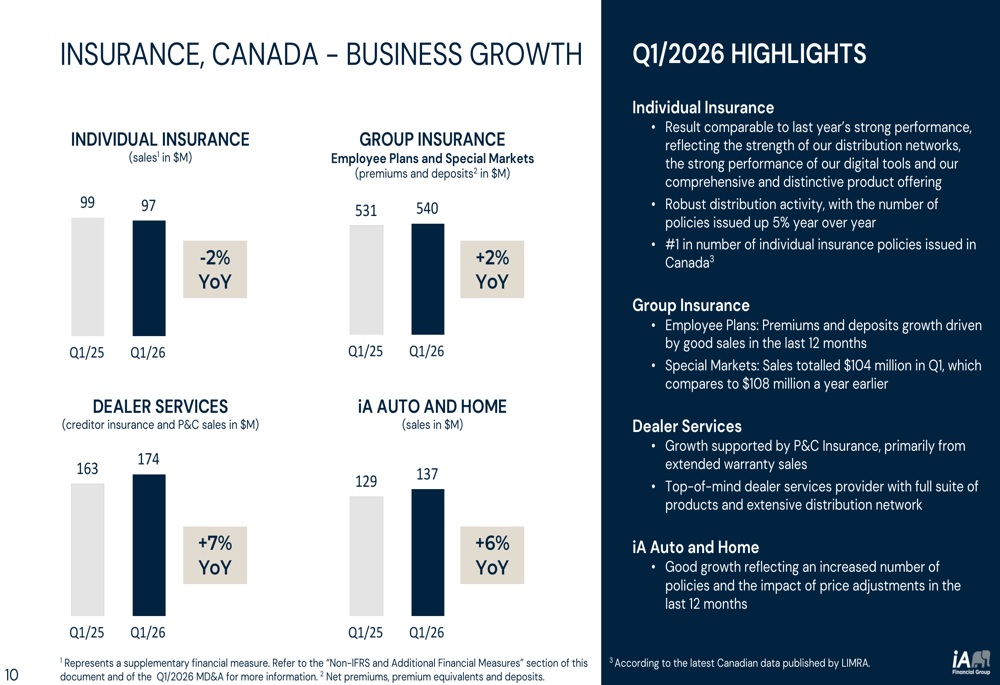
Individual insurance sales declined 2% to $97 million, though the number of policies issued increased 5%, positioning iA as #1 in Canada by this metric. Group insurance net premiums and deposits grew 2% to $540 million, driven by employee plans. Dealer services sales increased 7% to $174 million, supported by property and casualty insurance and extended warranty products. iA Auto and Home sales rose 6% to $137 million on increased policies and price adjustments.
US operations presented a mixed picture. Individual insurance sales jumped 16% to US$79 million, showing strength in final expense and middle market segments. However, dealer services sales fell 11% to US$273 million, reflecting industry-wide slowdown in car sales and the absence of prior-year benefits from anticipated vehicle price increases.
Financial Targets and Performance
The company’s progress toward its 2026 financial targets demonstrates strong execution on most key metrics.
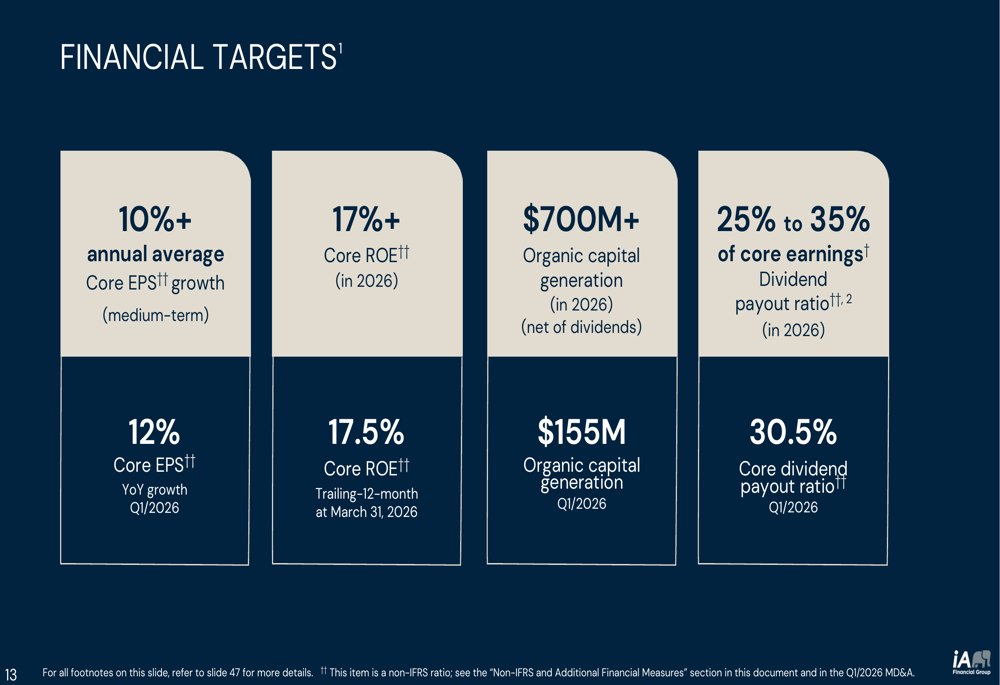
iA Financial exceeded its medium-term core EPS growth target of 10%+ with 12% year-over-year growth in Q1. The trailing twelve-month core ROE of 17.5% already surpassed the full-year 2026 target of 17%+. Organic capital generation of $155 million in the quarter put the company on track toward its $700 million+ annual target (net of dividends). The core dividend payout ratio of 30.5% fell within the targeted 25-35% range.
Segment Profitability Analysis
Wealth management led profitability growth, with core earnings detailed in the following analysis.
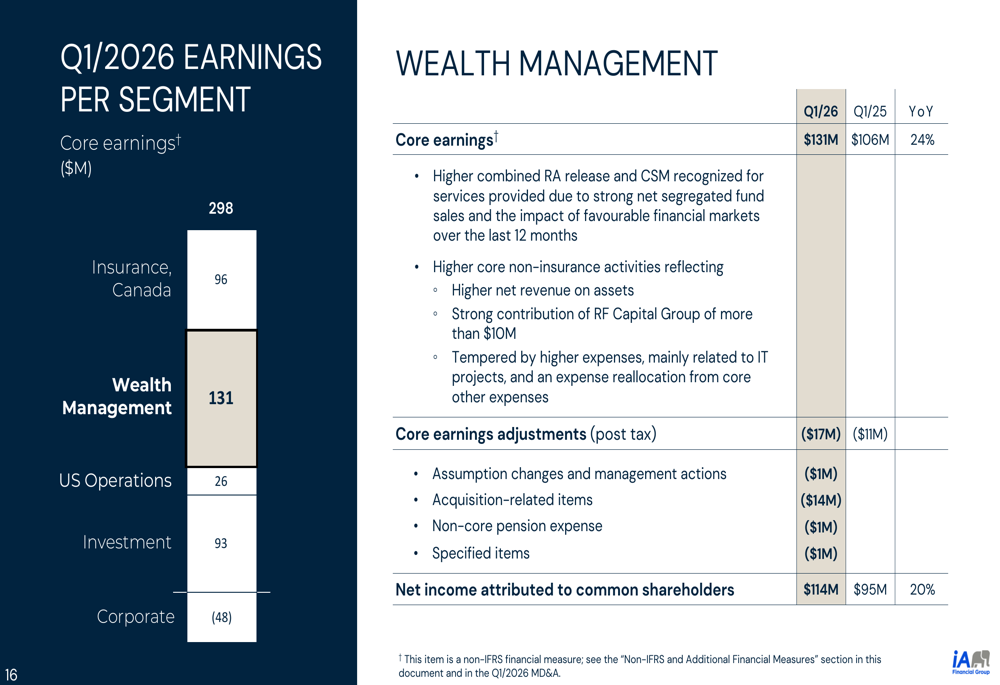
Wealth management core earnings increased 24% to $131 million, driven by higher contractual service margin release and risk adjustment from strong segregated fund sales and favorable markets. Net revenue on assets and contributions from RF Capital Group also supported results, partially offset by higher expenses. Net income attributed to common shareholders reached $114 million, up 20% year-over-year.
Insurance Canada’s performance showed the challenges facing traditional insurance operations.
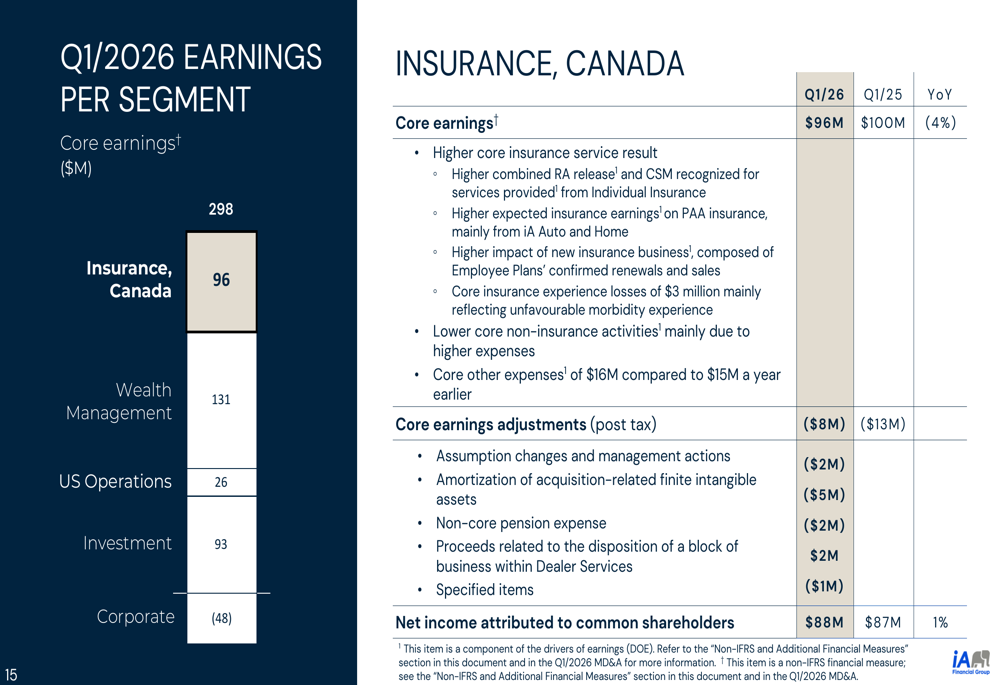
Core earnings for Insurance Canada declined 4% to $96 million, despite higher contractual service margin and risk adjustment release. The segment experienced $3 million in core insurance experience losses, and lower core non-insurance activities weighed on results. Net income attributed to common shareholders was $88 million, up just 1% year-over-year.
US operations faced headwinds with core earnings falling 13% to $26 million, impacted by $9 million in core insurance experience losses despite good business growth in individual insurance and higher expected earnings from dealer services. Vericity’s contribution continued to support financial expectations.
Capital Position and Deployment
The company’s capital strength remained a key highlight, as shown in the following detailed capital movements.
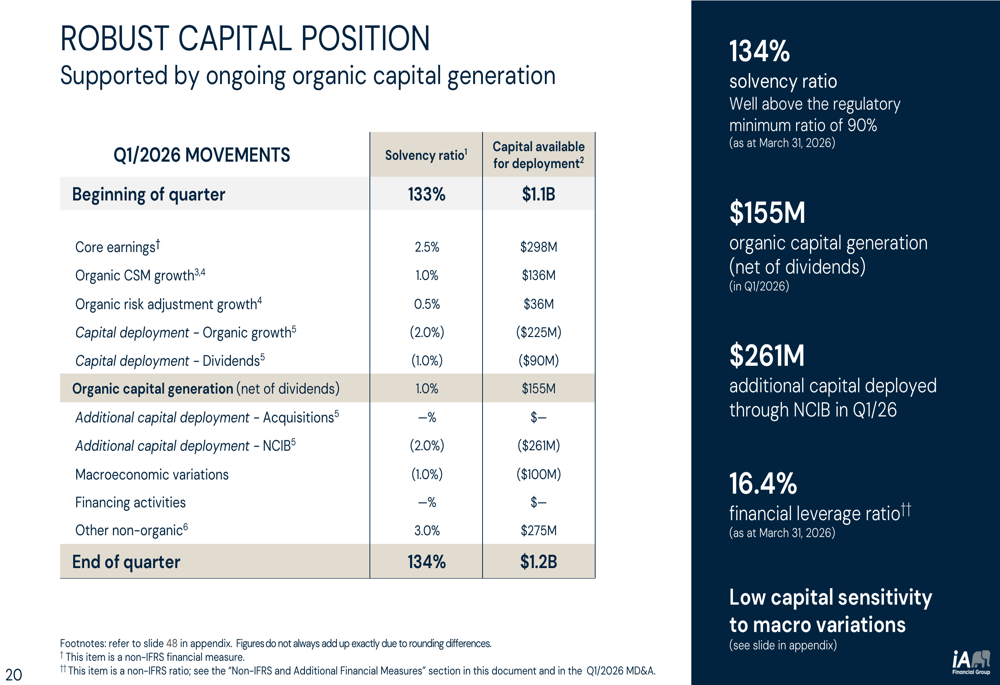
The solvency ratio improved from 133% at year-end 2025 to 134% at March 31, 2026, despite significant capital deployment. Core earnings contributed 2.5 percentage points, while organic CSM growth added 1.0 percentage point and organic risk adjustment growth contributed 0.5 percentage points. After accounting for capital deployment for organic growth (2.0 percentage points), dividends (1.0 percentage point), and share buybacks (2.0 percentage points), organic capital generation net of dividends added 1.0 percentage point to the solvency ratio.
Macroeconomic variations reduced the ratio by 1.0 percentage point, while other non-organic items added 3.0 percentage points. The $1.2 billion in capital available for deployment provides substantial flexibility for the company’s four capital allocation priorities: organic growth, disciplined acquisitions, dividends, and share buybacks.
Strategic Initiatives
Management outlined several strategic priorities, including senior leadership evolution and operational efficiency initiatives. The company created a dedicated executive role to lead acquisition-driven business development, with Benoit Hudon appointed as EVP, Corporate Strategy and Development. The leadership strategy focuses on attracting international talent, promoting internal mobility, and developing leaders.
The following summary captures the company’s strategic framework and key takeaways from the quarter.
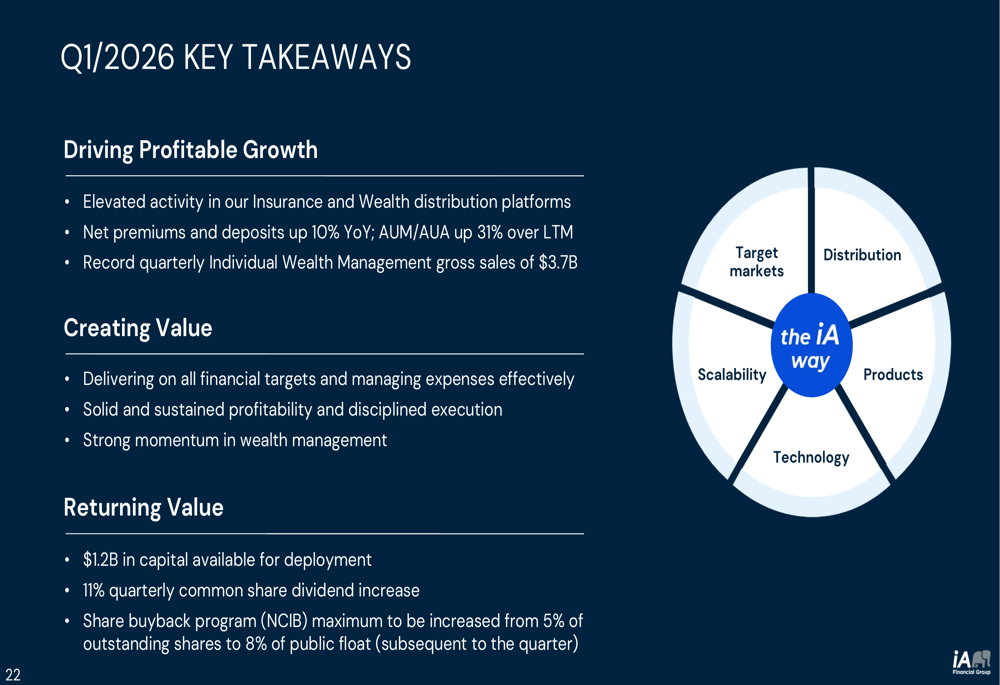
“The iA way” encompasses five strategic pillars: target markets, distribution, products, technology, and scalability. Management emphasized driving profitable growth through elevated activity in insurance and wealth distribution, creating value through effective expense management and sustained profitability, and returning value through increased dividends and share buybacks.
Corporate expenses came in at $65 million pre-tax in Q1, at the low end of the $70 million ± $5 million quarterly target, reflecting lower variable compensation and deferred corporate initiatives. Operational efficiency initiatives continue from 2022 project reviews through 2024+ regulatory completions, digital transformation, cost-conscious growth, and workforce management.
Investment Portfolio and Risk Management
The company’s $46 billion investment portfolio maintained a conservative profile, as illustrated in the following asset allocation.
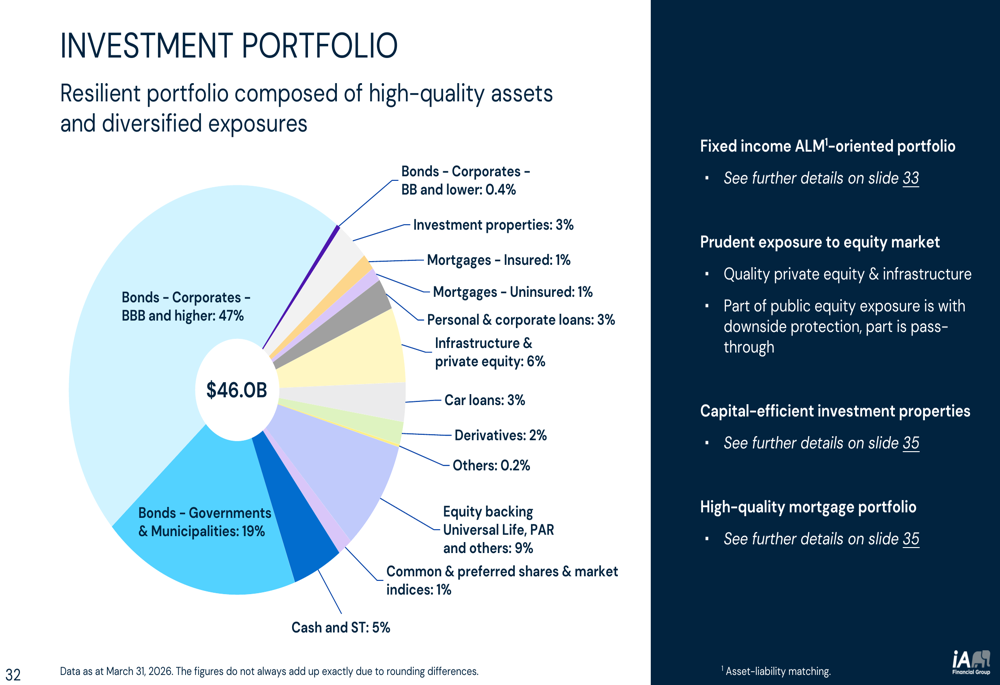
The portfolio consists primarily of investment-grade bonds (66% of total), with 47% in BBB-rated or higher corporate bonds and 19% in government and municipal bonds. The average credit rating stands at A, with no exposure to collateralized loan obligations. Private equity and infrastructure investments represent 6% of the portfolio, while investment properties account for 3%.
The bond portfolio’s quality is further detailed in the following breakdown.
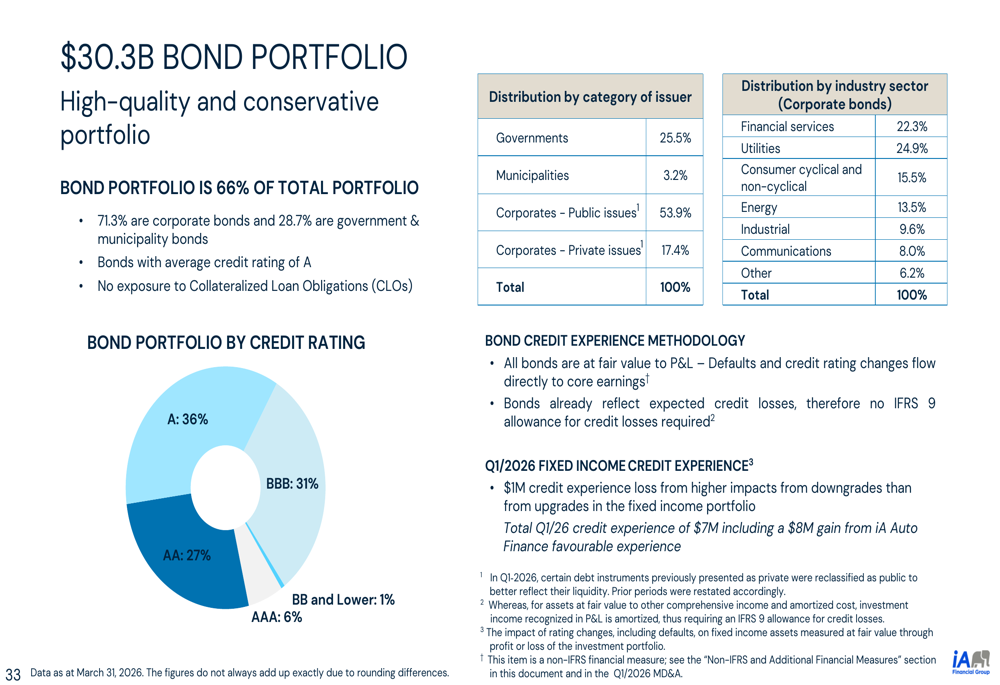
Corporate bonds comprise 71.3% of the $30.3 billion bond portfolio, with government and municipal bonds making up the remainder. The portfolio shows strong diversification across sectors, with utilities (24.9%), financial services (22.3%), and consumer sectors (15.5%) representing the largest exposures. Fixed income credit experience showed a $1 million loss in Q1, while total credit experience was positive at $7 million including an $8 million gain from iA Auto Finance.
Long-Term Value Creation
The company’s track record of book value growth demonstrates consistent value creation over time.
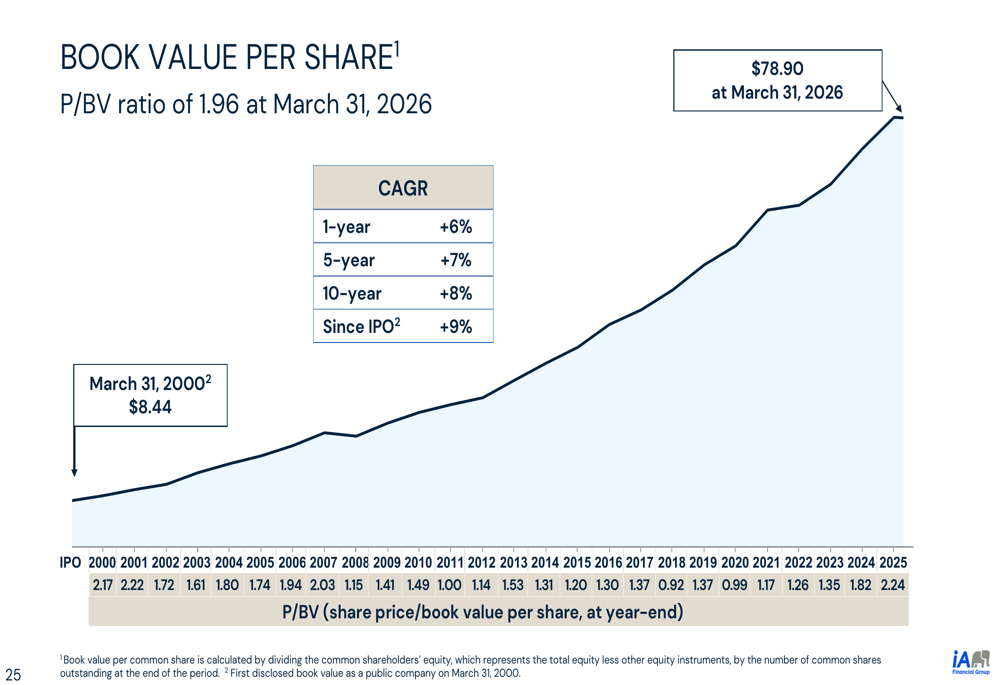
Book value per common share reached $78.90 at March 31, 2026, up 6% year-over-year. Since the company’s IPO in 2000, book value has grown from $8.44 to $78.90, representing a 9% compound annual growth rate. The one-year, five-year, and ten-year CAGRs of 6%, 7%, and 8% respectively show accelerating value creation. The price-to-book ratio stood at 1.96 at quarter-end.
Dividend growth has been equally impressive, as shown in the following historical trend.
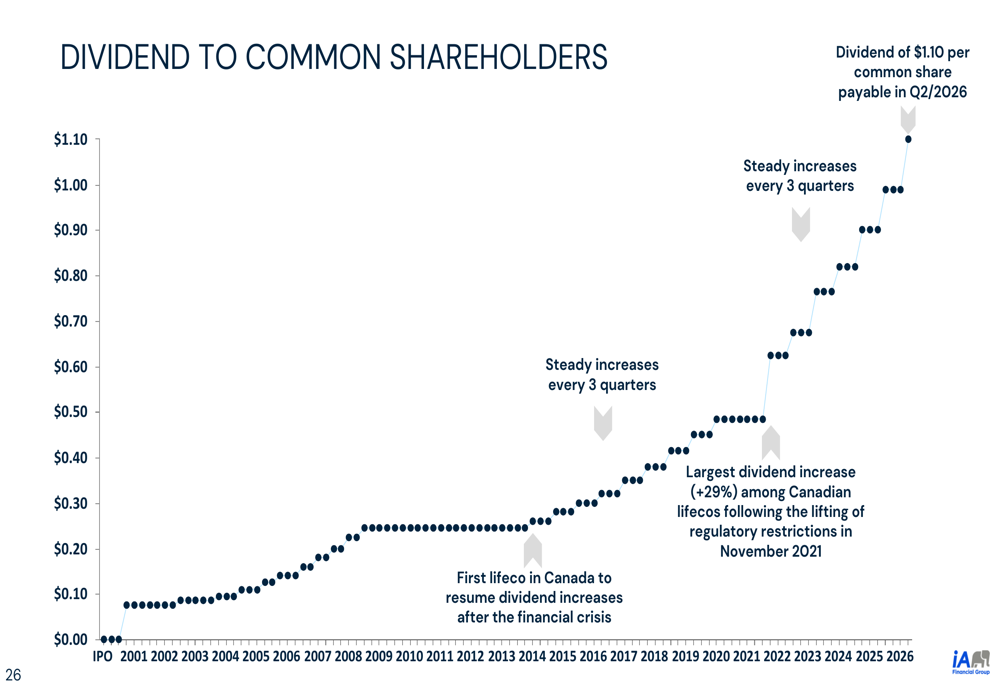
The quarterly dividend has increased from below $0.10 in 2000 to $1.10 in Q2/2026. iA Financial was the first life insurer in Canada to resume dividend increases after the financial crisis and delivered the largest dividend increase (29%) among Canadian life insurers following the lifting of regulatory restrictions in November 2021.
Assets Under Management Growth
The company’s asset gathering momentum is evident in the long-term growth trajectory.
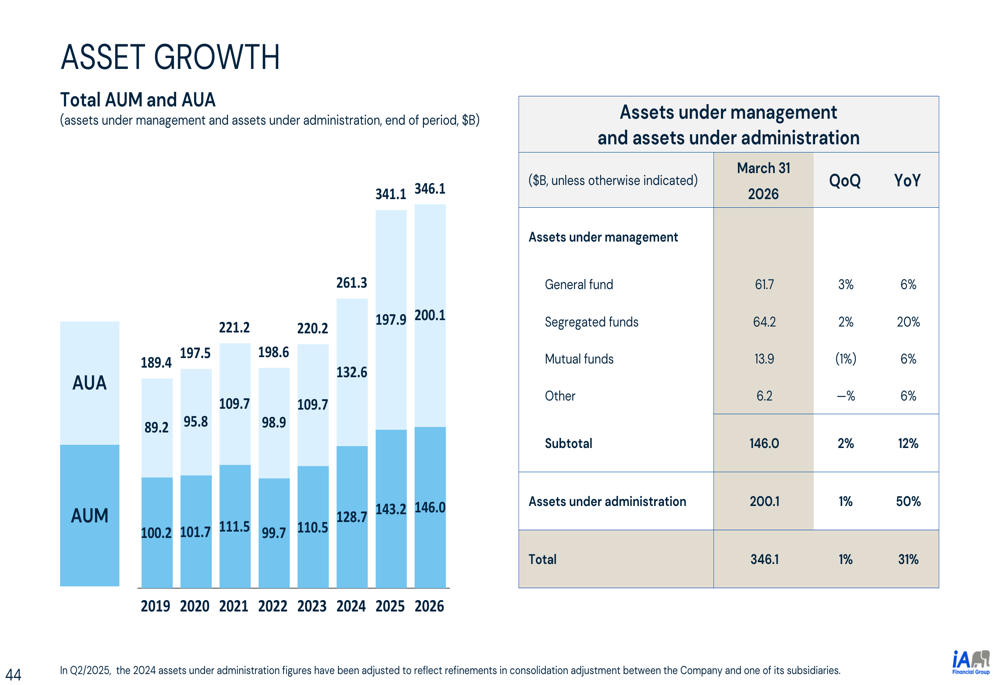
Total assets under management and administration grew from $189.4 billion in 2019 to $346.1 billion at March 31, 2026, with particularly strong growth in assets under administration, which increased 50% year-over-year to $200.1 billion. Assets under management reached $146.0 billion, with segregated funds growing 20% to $64.2 billion.
The historical trend in net premiums and deposits shows consistent business momentum.
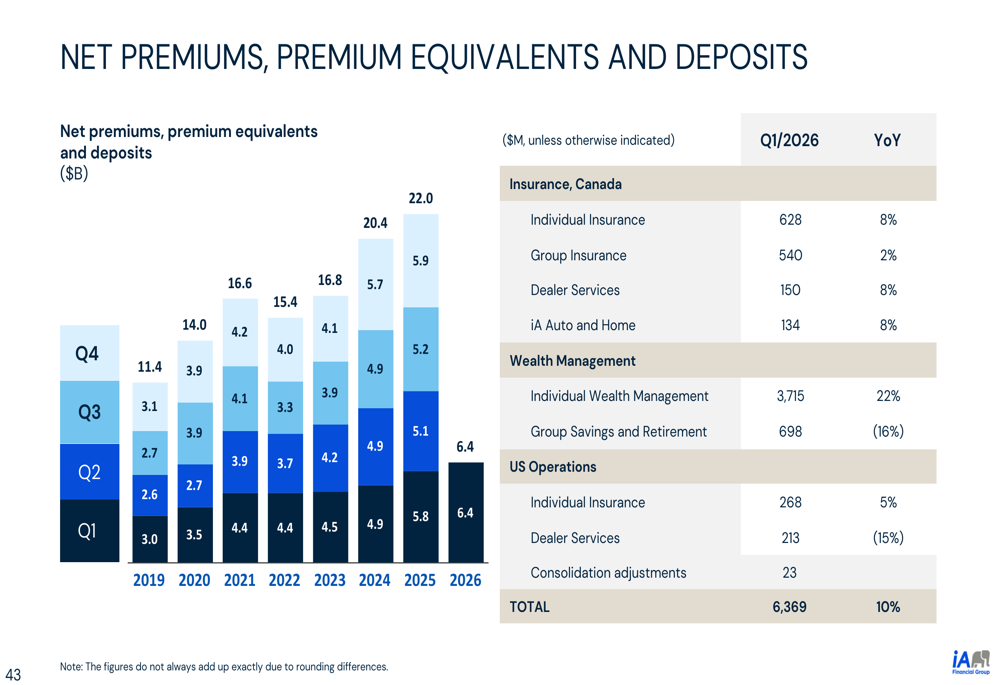
Net premiums, premium equivalents, and deposits reached $6.4 billion in Q1/2026, up 10% year-over-year, putting the company on pace for $22.0 billion annualized. Individual wealth management contributed $3.7 billion, while individual insurance, group insurance, and dealer services in Canada each contributed between $150 million and $628 million.
Forward-Looking Statements
Management maintained its 2026 financial targets despite Q1 market headwinds. The company expects to achieve 10%+ average annual core EPS growth over the medium term, 17%+ core ROE in 2026, and organic capital generation exceeding $700 million net of dividends for the full year. The dividend payout ratio target remains 25-35% of core earnings.
The presentation included extensive disclaimers noting that forward-looking statements involve risks including general business conditions, competition, information technology risks, inflation, market volatility, interest rate fluctuations, regulatory changes, geopolitical tensions, and climate-related risks.
While the company’s core operational performance remained strong with double-digit earnings growth and record wealth management sales, the stock’s 8.85% decline on presentation day suggests investors may be concerned about the sustainability of earnings amid market volatility, the divergence between core and reported results, and challenges in certain insurance segments. The expanded share buyback program and increased dividend signal management’s confidence in the business despite near-term headwinds.
Full presentation:
This article was generated with the support of AI and reviewed by an editor. For more information see our T&C.