


John P. Hussman, Ph.D.
President, Hussman Investment Trust
June 2026
This is what produces bull market tops. Obviously no one rationally would want to buy at the top, and yet enough people do to produce a top. It’s really quite amazing how time horizons and money goals can change when there are stocks around that are going up 100 percent in six months.
– Adam Smith (GJW Goodman), The Money Game, 1967
With valuations at the most extreme point in U.S. stock market history, pressed to fresh extremes by a wildly narrow advance in “AI adjacent” stocks, it’s tempting to warn investors that bubbles typically end badly – that even the final doubling, and tripling, and quadrupling, and quintupling of the Nasdaq 100 during the late-1990’s tech bubble was wiped away in the collapse that followed. Instead, let’s talk about the hippo.
You heard me.
On a recent trip to Africa, after working with some partners of the Hussman Foundation there, we spent two days in Kenya at a reserve where animals can roam freely (fortunately, most are monkeys, but you do need a Maasai warrior to escort you to your cabin at night). The lovely pond, we were told, was home to several alligators, and a “resident hippo.”
This was not my call. I think we all know how I respond to inadequate return/risk profiles. I was more at peace amid the poorest and most challenging areas of Kenya and Rwanda than I was with the idea that I might accidentally wander between the hippo and the pond. See, hippos look like lumbering cartoon river cows that might be fun to see up close. The truth is that they’re the deadliest large animal to humans on the face of the earth. Not because they’re carnivores. They’re not. Rather, as a friend explained, it’s because if you get in their way, they just, chomp. They open their mouths 150 degrees, then, chomp. What makes this even more dangerous is that the risk is vastly underestimated.
Speculative bubbles are the same way. It’s all fun and exciting until you get a little too confident, or wade in to get the full experience. Then, well, chomp. That doesn’t mean we need to run away at full speed. It just means we have to recognize the danger, and refrain from being too sure about our safety.
As historically-informed investors, we have to observe that current conditions are no less extreme than at the 1929 and 2000 bubble peaks. Even so, we needn’t rely on any pointed forecast or scenario about what might happen next. We can take good care of the future simply by taking good care of the present moment, again and again, as conditions change.
In order for valuations to reach the most extreme level in the history of the U.S. financial markets, it must be true, by definition, that valuations have plowed through every lesser extreme, time and time again, without consequence. Unfortunately, the deferral of consequences is often confused with the absence of consequences. As investors, we should be capable of seeing both the possible continuation of the bubble, and also the possible collapse of the bubble. Knowing that both are possible, and refraining from being locked into any forecast or scenario, we see better what to do and what not to do.
If we embrace the “new era” side too strongly, we may be led to chase risk without a safety net. But if we embrace the lessons of history too strongly – and I’ve often been susceptible to that – we may rely on the bubble to end on the same timeline that other bubbles have. We can reconcile the situation by accepting the extreme risk that’s embedded into record valuations, wildly exuberant earnings projections, and extrapolative speculation about novel technologies, but also to identify ways to be happy even if the bubble doesn’t end for some time.
If you’ve been following our market comments in recent months, particularly the February comment, How I Learned to Love the Bubble (Even Before it Bursts) and the early May comment (More) Roses amid Garbage and Trap Doors, you know that’s exactly how we’ve adapted.
On one hand, we’ve adapted our hedging approach to be far more constructive and flexible – yet still risk-conscious – than I would have imagined was possible in previous market cycles, including the dot-com and mortgage bubbles. These same adaptations would have benefited our strong full-cycle performance even then. For example, amid the 2000-2002 market collapse, about a quarter of weekly periods would now be classified as constructive under our February/May adaptation. Those periods – which largely overlap intermittent “bear market rallies” – amount to a cumulative advance in the S&P 500 of close to 50% – quietly embedded within that bear market itself.
Of course, when market internals are unfavorable, as they were during the 2000-2002 collapse, any “constructive” stance would require a safety net – generally using out-of-the-money index put options. Similarly, given the extreme valuations and unfavorable market internals we have today, any prudent “constructive” investment stance would also include a meaningful safety net.
As I’ll detail later in this comment, adopting a “constructive” stance when valuations and market internals are unfavorable is not about trying to “jump into the market” or “catch” advances. Rather, it’s about identifying brief periods that are so hostile to a hard-negative hedge position that it makes sense to remove the component of the hedge that “fights the market” and places a cap on upside gains, while still maintaining the component of the hedge that acts as a safety net against significant market losses.
It remains true that we prefer a certain amount of market fluctuation to an uncorrected diagonal ramp. Yet as much as historical valuation norms suggest a market loss on the order of 70% on the other side of this bubble, I expect we can just as easily welcome a future in which the bubble never ends. As I noted several weeks ago, “It’s far more than enough for us that so many roses could exist amid market conditions that a century of history taught us were garbage.”
Valuation review
The ‘new-era’ doctrine – that ‘good’ stocks (or ‘blue chips’) where sound investments regardless of how high the price paid for them — was at bottom only a means for rationalizing under the title of ‘investment’ the well-nigh universal capitulation to the gambling fever… Why did the investing public turn its attention from dividends, from asset values, and from earnings, to transfer it almost exclusively to the earnings trend? The answer was, first, that the records of the past were proving an undependable guide to investment; and secondly, that the rewards offered by the future had become irresistibly alluring.
The notion that the desirability of a common stock was entirely independent of its prices seems incredibly absurd. Yet the new-era theory led directly to this thesis. If a stock was selling at 35 times the maximum recorded earnings, instead of 10 times its average earnings, which was the pre-boom standard, the conclusion to be drawn was not that the stock was too high but merely that the standard of value had been raised. Instead of judging the market price by established standards of value, the new-era based its standards of value on the market price.
– Benjamin Graham & David Dodd, Security Analysis Principles and Techniques, 1934
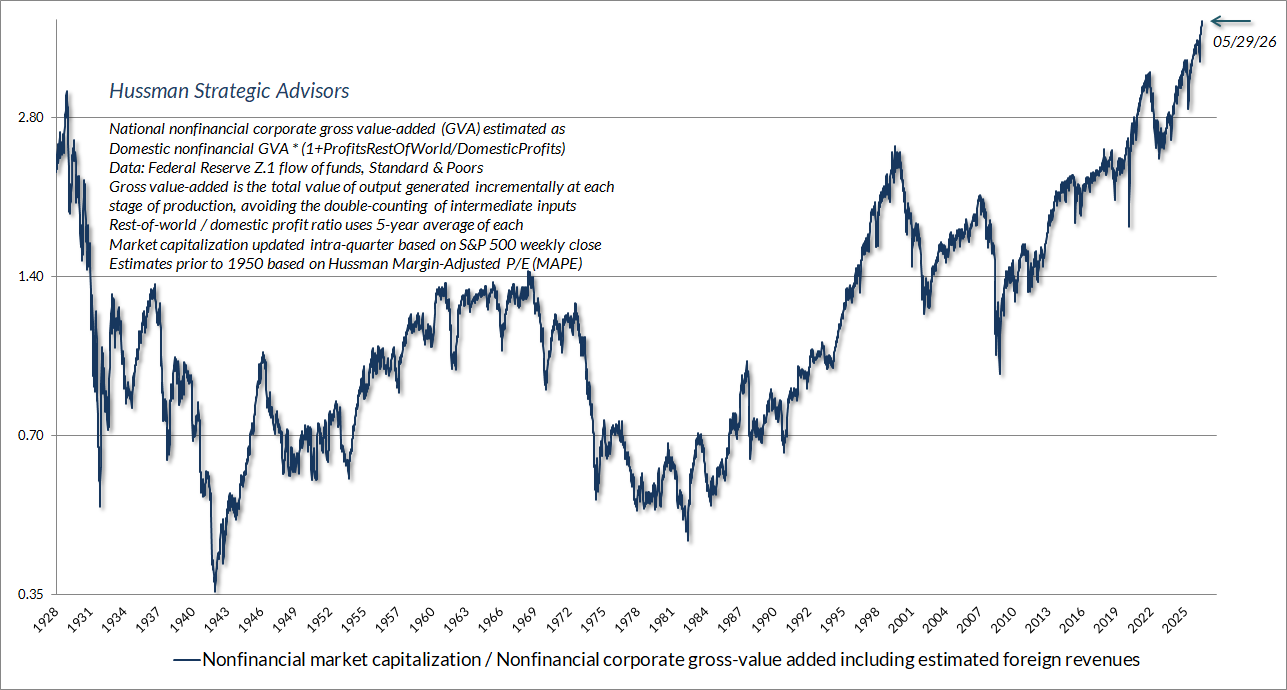
The U.S. equity market has again pushed to the most extreme valuations in history, on the measures we find best correlated with actual subsequent market returns across a century of market cycles. The chart below shows our most reliable gauge of market valuations in data since 1928: the ratio of nonfinancial market capitalization to gross value-added (MarketCap/GVA). Gross value-added is the sum of corporate revenues generated incrementally at each stage of production, so MarketCap/GVA might be reasonably be viewed as an economy-wide, apples-to-apples price/revenue multiple for U.S. nonfinancial corporations.
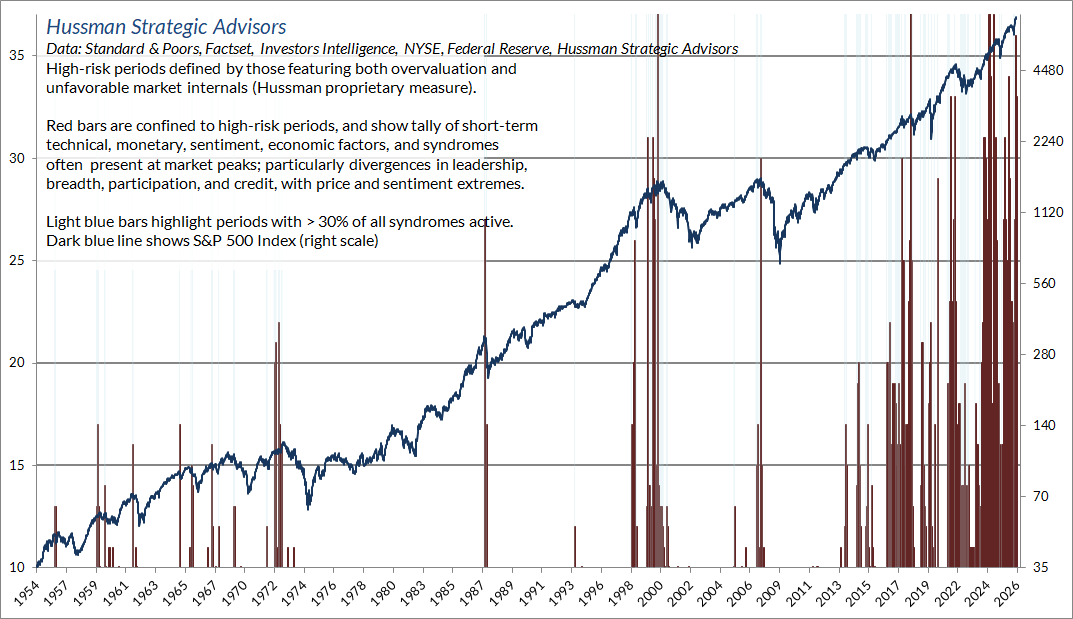
As historically-informed investors, it’s also worth noting that we currently have one of the largest preponderances of daily and weekly warning flags in history. As I observed in the November 2021 comment Motherlode, “There are certain features of valuation, investor psychology, and price behavior that emerge, to one degree or another, when the fear of missing out becomes particularly extreme and the focus of speculation becomes particularly narrow. We’ve suddenly hit a motherlode of those conditions. Emphatically, this is not a forecast. It’s a statement about current, observable conditions.”
I can say a thousand times that we don’t rely on forecasts, or scenarios, or market calls, but it’s evidently futile. So I’ll say this anyway: even excluding valuation considerations, recent market action is consistent with precisely the type of market behavior one observes at speculative tops. We don’t rely on that at all, but we can’t describe this romping goat rodeo any other way.
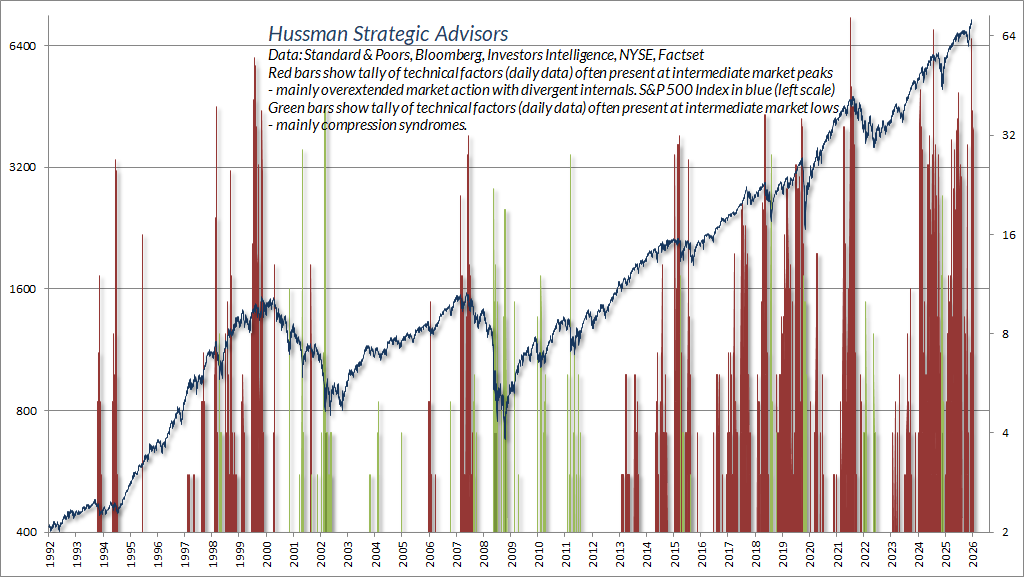
Over the past 40 years, I’ve created scores of overextension flags, both positive and negative. Since they’re all what I’d call “weak sensors”, the information is most reliable when a large number of warning flags or compression flags cluster at the same time. Here’s what the tally looks like in daily data since 1992.
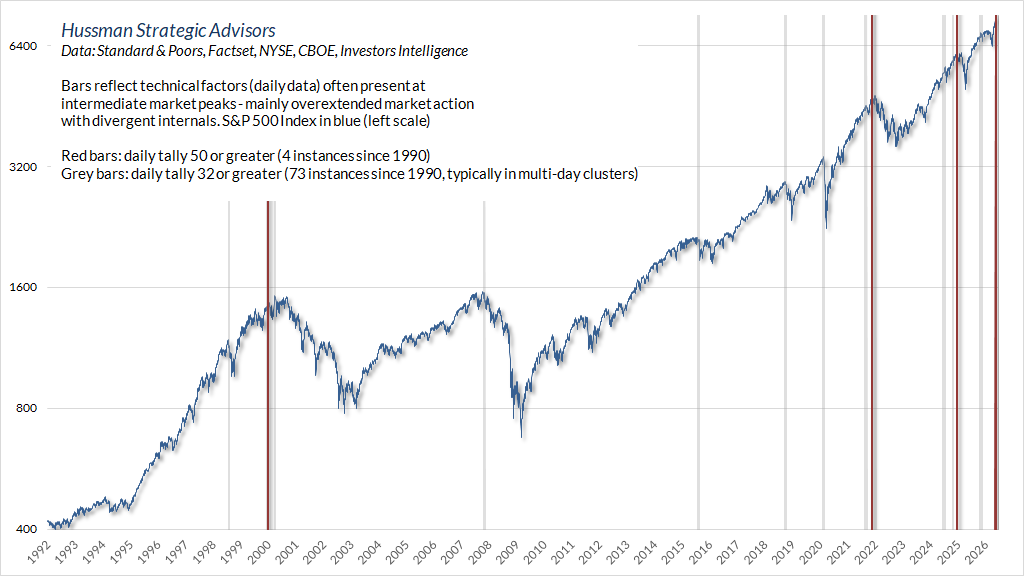
There are only four times, including a recent session, when we’ve seen more than 55 warning flags kick in a single day. Those instances, which include the tech bubble peak on March 24, 2000, are shown as red bars. The grey bars show sessions with more than 32 warning flags on the same day. There are more bars, but they generally emerge in clusters. Recent market action is no exception – we’ve seen six such days in the past two weeks.
The chart below shows a different set of warning flags that we maintain in weekly data. The record high was 40 the week of March 24, 2000. The past two weeks have been consecutive counts of 36. Again, there’s no assurance that the market doesn’t advance further, and nothing in our discipline relies on a market peak. It’s just been my practice for decades to share what I’m seeing, and I do think that these extremes should reasonably figure into the risk assessments of investors.
In July 2000, the Wall Street Journal ran an article titled (in the print version) “What were we THINKING?” – reflecting on the “arrogance, greed, and optimism” that had already been followed by the collapse of dot-com stocks. My favorite line: “Now we know better. Why didn’t they see it coming?” Unfortunately, that article was published at a point where the Nasdaq still had an 80% loss (not a typo) ahead of it. As I wrote in August 2000, “Investors seem to have the quaint notion that somehow this devastation is behind us. Our view is that the massive bubble in tech stocks is only beginning to burst. The recent dot-com plunge merely skimmed away the foam.”
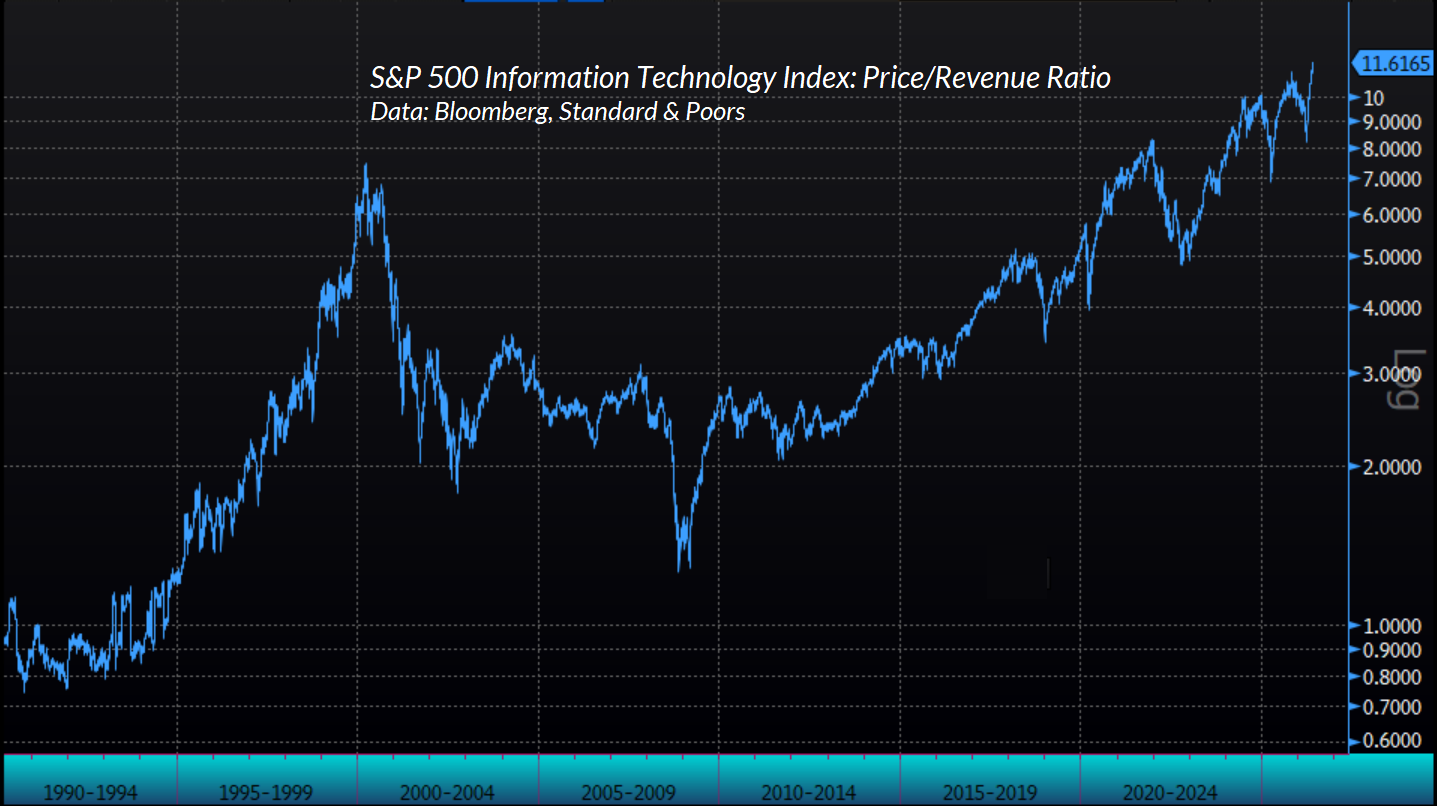
The S&P 500 Information Technology Index presently trades at a price/earnings multiple of 45, on earnings that benefit from a record operating profit margin of 30%, well over three times the historical norm in prior market cycles. This is equivalent to saying that at historically normal profit margins in the information technology sector, the price/earnings multiple would be well over 135. One can take the present multiple of 45 at face-value only if one relies on the continuation of record profit margins forever. Meanwhile, the price/revenue multiple stands above 11.6.
Recall that when Joseph Schumpeter described “creative destruction,” and Adam Smith described the “invisible hand,” they envisioned an economic system where potential opportunities for profit would create an incentive for innovation by those who were best capable of filling unmet needs. But they also saw profits as inherently self-destructive, because profit opportunities would encourage a “swarm-like” activity of other entrepreneurs. That competition would expand production, and simultaneously produce economic growth while eroding excessive profits.
Observing the frantic “swarm-like” buildout of AI capacity, investors are paying valuations that essentially assume that this frenzy of spending, revenues, and profits will be sustained, year-after-year, forever. Indeed, at a P/E of 45 one has to assume that it will grow at a considerable rate from here. Nothing in our investment discipline requires us to rule this out, but it’s worth observing that across history, extreme speculation of this sort has ultimately been punished rather violently.
Of course, taking current record revenues and profit margins at face-value does “improve” earnings-based valuation multiples, but it’s important to remember that a valuation ratio is nothing but shorthand for a proper discounted cash flow analysis. A valuation multiple implicitly assumes that the denominator is proportional and representative of long-term (decades and decades and decades) future cash flows. If profit margins are elevated, but may only be elevated for 5 or 10 years, taking the price/earnings multiple at face value will give you a strikingly optimistic view of where valuations stand.
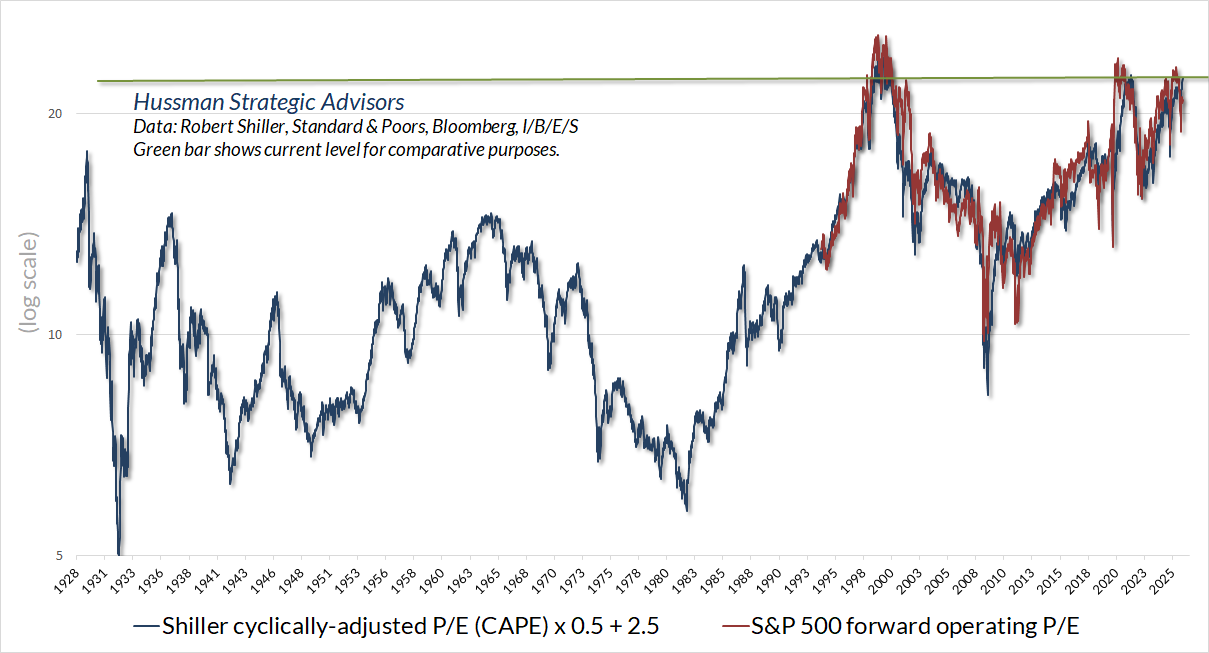
Here is what that face-value P/E multiple looks like here, based on analyst estimates of year-ahead S&P 500 forward operating earnings. Since “forward operating earnings” were only invented by Wall Street in the 1980’s, and popularized in the 1990’s, the chart also shows our estimate of what the forward P/E would have looked like across history, had this measure been available.
In my market comment at the 2000 bubble peak, I included the same quote from Graham and Dodd that opened this section, and discussed the “new economy” theme that has always gone hand in hand with speculative extremes. Again, observing these extremes is not a market call. While a market collapse on the order of 70% in both technology stocks and the broad market in the coming years would leave me wholly unsurprised, nothing in our investment discipline relies on significant market losses.
I hope I’ve been sufficiently emphatic that we’ve adapted to the point where we expect to be quite happy even if this bubble never ends. At the same time, I think it’s reasonable to observe that investors whose portfolios include neither safety nets nor alternative assets may be standing directly between the pond and a very large hippo.
In recent months, we have made the rather bizarre assertion that the Nasdaq is likely to lose somewhere between 65% to 83% of its value from its recent highs to its ultimate bottom. In the March letter, we reviewed the S&P 500 technology stocks, noting that the P/E on those stocks had reached 70, compared to a 1975-1995 average P/E of just 17. Meanwhile, the price/revenue ratio for those stocks had reached 6.8, compared to a 1975-1995 average of just 1.1
The argument of the ‘new economy’ crowd? Yes, but they’re great companies (‘good stocks’), you would have been wrong to be against them (‘records of the past had proved an undependable guide to investment’), what drives stocks is not the valuation multiple, but only whether these companies beat earnings estimates (‘from dividends, from asset values, and from earnings, to transfer it almost exclusively to the earnings trend’), a ‘new economy’ warrants entirely different valuation methods (‘the standard of value had been raised’), and anyway, a stock is worth whatever price investors are willing to pay for it (‘the new-era based its standards of value on the market price’). ‘Hence’, as Graham & Dodd recounted about the run-up to the 1929 crash, ‘all upper limits disappeared, not only upon the price at which a stock could sell, but even upon the price at which it would deserve to sell.’
– John P. Hussman, Ph.D., Hussman Econometrics, April 7, 2000
Forgetting what we know
One of the striking aspects of a speculative bubble is how many investment professionals who ought to know better somehow forget what they know. We saw this during the tech bubble and the mortgage bubble – how the lure of seemingly easy money and sure-fire returns encouraged countless portfolio managers to drift into top-heavy overweighting in technology stocks or financial stocks. Meanwhile, fixed income investors, hedge funds, and institutions across the entire banking system were lured into mortgage-backed securities that seemed to promise that 2 plus 2 could somehow equal 5.
Ten companies now comprise 40% of the S&P 500 Index. Bank of America’s May 2026 Global Fund Manager Survey reported the highest jump in equity exposure on record, with a net overweight of 50% among investment managers (% of managers overweight stocks – % of managers underweight stocks, relative to outstanding market capitalizations). That’s the highest overweight since January 2022, just before the S&P 500 gave up about a third of its value.
For our part, we don’t rely on a steep market losses here, but we certainly don’t rule them out. Greater flexibility in our investment positioning should be more than enough for us to be happy. The key point is that, as in the tech and mortgage bubbles, investment managers are responding by amplifying their risk rather than taking actions that exert any kind of stabilizing influence.
My impression is that as the bubble has progressed, many investment professionals have sidelined everything they’ve learned about portfolio construction, choosing instead to carry unhedged exposure to a handful of “passive” market indices. This is nothing new. The progressive embrace of passive investment strategies has been a feature of every speculative bubble in history.
After the 1929-1932 market collapse, for example, Graham & Dodd detailed the arguments that had lured investors to turn their attention away from valuations in favor of passive investing: “This gospel was based on a certain amount of research, showing that diversified lists of common stocks had regularly increased in value over stated intervals of time for many years past… It was only necessary to buy ‘good’ stocks, regardless of price, and then to let nature take her upward course. The results of such a doctrine could not fail to be tragic.”
So yes, we’ve seen a progressive embrace of passive investing as this bubble has progressed. At the same time, however, we need to be careful about how we interpret so called “passive flows”. In particular, we should hesitate to interpret the psychological embrace of passive investing as if it places some kind of structural support under the market. As I wrote in March,
The idea that the accumulation of outstanding shares by price-insensitive investors can drive ‘risk-premiums’ lower, and therefore drive prices higher, is consistent with even my own academic research decades ago.
The problem is that in order to convert this idea into a theory of bubbles and permanent price impact, one needs to take literally the idea that a progressively increasing fraction of outstanding shares is held by investors who honestly do not care about expected returns or risk-premiums – and remain indifferent even to enormous cumulative reductions in likely future returns.
In effect, you’re assuming that price insensitivity applies not only to the marginal transaction (the order ‘fill’) but to the entire investment position. Given that assumption, and holding all other things equal, equilibrium implies that valuations are an increasing function of the holdings of passive investors. But this means – equivalently – that the holdings of passive investors progressively increase as their expected future returns decline, and that passive investors are just fine with that. The reason this poses no obstacle to equilibrium is because we’ve assumed that passive investors don’t care about expected returns – durably, and with respect to their entire position.
John P. Hussman, Ph.D., Equilibrium and the Dentist in Poughkeepsie, March 2026
I’m not at all convinced that price-insensitive “flows” or mechanical “elasticity” are what’s driving current valuation extremes. Rather, investors have expectations about future returns – in their heads – that both encourage and reinforce passive investment strategies, and these expectations about future returns have had a self-reinforcing impact on prices.
The distinction isn’t just semantics. If one views bubbles as Graham & Dodd did – that investors do care about likely future returns, but that their expectations are misaligned, then the idea of “flows” is dispensable because no distinction between “passive” and “active” investors is required. A bubble requires only that consensus expectations about future returns are misaligned with the expected returns implied by fundamentals (see the Geek’s Note in The Bubble Term); a collapse requires only that the expected returns in the heads of investors become realigned with prevailing valuations.
The vast majority of investors, in my view, are just as interested in future returns as value-conscious, price-sensitive investors are. It’s just that they’re also convinced that the future returns will be glorious. It’s not the mechanical quantity effect of their holdings – the share of outstanding stock they hold – that has driven prices higher. It’s the expectations in their heads. No significant amount of “selling” needs to occur in order for the house of cards to collapse. All that needs to happen is for expectations to be realigned.
If a dentist in Poughkeepsie sells a single share of AAPL at a price that’s 7 cents below the previous trade, a billion dollars of market capitalization vanishes – a billion dollars, on $300 bucks of “flow.” As with the collapse of any bubble, it’s not necessary for a huge proportion of investors to “sell”. What’s required is only that expectations and risk-preferences shift.
Portfolio construction and the role of alternative investments
As investors, we shouldn’t expect to be compensated simply for taking risk itself. A poorly diversified portfolio, for example, may have more volatility and extreme returns, but it doesn’t have a higher expected return. Instead, the level of compensation (the ‘risk premium’) investors can expect depends on how correlated or uncorrelated the returns of that security are to market risks that the investor can’t diversify away.
That’s why investors often have an ‘alternative sleeve’ in their portfolio allocations. A security that has zero sensitivity to overall market fluctuations and an expected return even slightly above the T-bill rate can actually be used to improve the return/risk profile of the portfolio. Likewise, a security that has a negative market sensitivity essentially acts as an insurance policy, and can improve the expected return/risk profile of the portfolio, versus an allocation between the market and cash alone, even if the expected return of the security is below the risk-free rate, and in some cases, even if the expected return is negative, provided that the security acts as a buffer when things go wrong.
Investors looking to maximize expected return for some target level of risk will take an ‘active’ position in a security if they believe it will provide them an ‘edge’ – an expected return above what they would normally expect based on its sensitivity to market fluctuations. This is true not only for an individual stock, but for any asset in the ‘alternative sleeve’ of an investment portfolio.
– John P. Hussman, Ph.D., Equilibrium and the Dentist in Poughkeepsie, March 2026
When I left teaching finance and economics at the University of Michigan and the Michigan Business School more than 25 years ago, I resolved to continue teaching through my writing. I’ve always considered these market comments as a way to share perspectives and investment research freely, and I rarely discuss the Hussman Funds directly. We don’t “market” the Funds because I prefer investors to find us through an understanding of our discipline rather than through advertisements. Given current market extremes, however, I think it’s worthwhile to discuss the Funds specifically, both to illustrate how alternative investments actually function in a portfolio, and because I believe the increasing concentration of investor portfolios in a single industry makes this a critical moment to think carefully about portfolio construction.
While not many investors have all of their financial investments in the Funds (I’m among the exceptions), many of our investors use the Hussman Funds as part of the “alternative sleeve” of their portfolios – as a way to lower the expected portfolio volatility for a given level of expected return, or to raise the expected portfolio return for a given level of volatility. Faced with the most extreme valuations in U.S. stock market history, now may be a particularly useful time for investors to consider the potential for alternative assets to improve the expected return/risk profile of their portfolios.
The essential feature of a useful alternative asset isn’t that it’s unusual or exotic, but that its returns aren’t tightly linked to the risks that already dominate the portfolio. The value of an alternative asset comes from the way it interacts with the other assets in the portfolio. The lower the correlation, particularly if the asset tends to hold value or advance when the rest of the portfolio is under pressure, the more the asset can improve the expected return/risk profile of the portfolio – even if the “standalone” return on that asset may be low.
A useful diversifying asset can improve the profile of return/risk either by raising expected return for a given level of portfolio risk, or by reducing portfolio risk for a given level of expected return. It is both naïve and incredibly dangerous to construct a portfolio simply by cobbling a group of assets together based on their standalone returns, particularly if those returns are backward-looking. As my friend and teacher Thich Nhat Hanh taught, in every context imaginable, nothing exists by itself alone.
To illustrate the diversifying role of alternative investments, the charts below reflect data from 2019 through mid-May 2026. Despite the challenges we encountered amid unprecedented monetary and fiscal policies during this bubble, we had adapted enough even by 2019 to restore the effective and useful role of the Hussman Strategic Market Cycle Fund (HSGFX) as an alternative investment. While later adaptations – September 2024, and particularly in February/May of this year – could have encouraged a constructive outlook much more frequently in recent years (and should encourage ample constructive stances going forward), by 2019 we were at least no longer “fighting” extreme valuations if our measures of market internals were still favorable.
In the charts below, I’ve used the State Street SPDR S&P 500 Index ETF (SPY) as an investable proxy for the S&P 500 Index, the State Street SPDR Bloomberg 1-3 Month T-Bill ETF (BIL) as an investable proxy for Treasury bills, and while all of the allocations assign zero weight to the Bloomberg U.S. Aggregate Bond Index during the 2019-2026 period, I’ve verified that using the iShares Core U.S. Aggregate Bond ETF (AGG) as an investable proxy for the broad U.S. investment grade bond market. More detailed disclosures follow at the end of this section.
The chart below shows various profiles of realized total return and risk (annualized standard deviation of returns) obtained by computing the portfolio weights that minimized portfolio volatility for each level of realized total return, or equivalently, that maximized realized total return for each level of portfolio volatility. The three lines correspond to three different sets of investment choices. The diagonal red line shows the optimal tradeoff using only the S&P 500 (SPY) and Treasury bill (BIL) ETFs as asset choices. We could also include the Bloomberg U.S. Aggregate Bond Index as an additional asset choice here, but again, all of the allocations assign it a zero weight during the 2019-2026 period, so I’ve left it out for simplicity.
The purple line shows the impact of adding the Strategic Market Cycle Fund (HSGFX) as a potential portfolio asset. The blue line includes the Strategic Total Return Fund (HSTRX) as an additional alternative asset. Strategic Total Return received particularly large weights at moderately conservative total return targets, because the additional return relative to T-bills outweighed the incremental risk during this period.
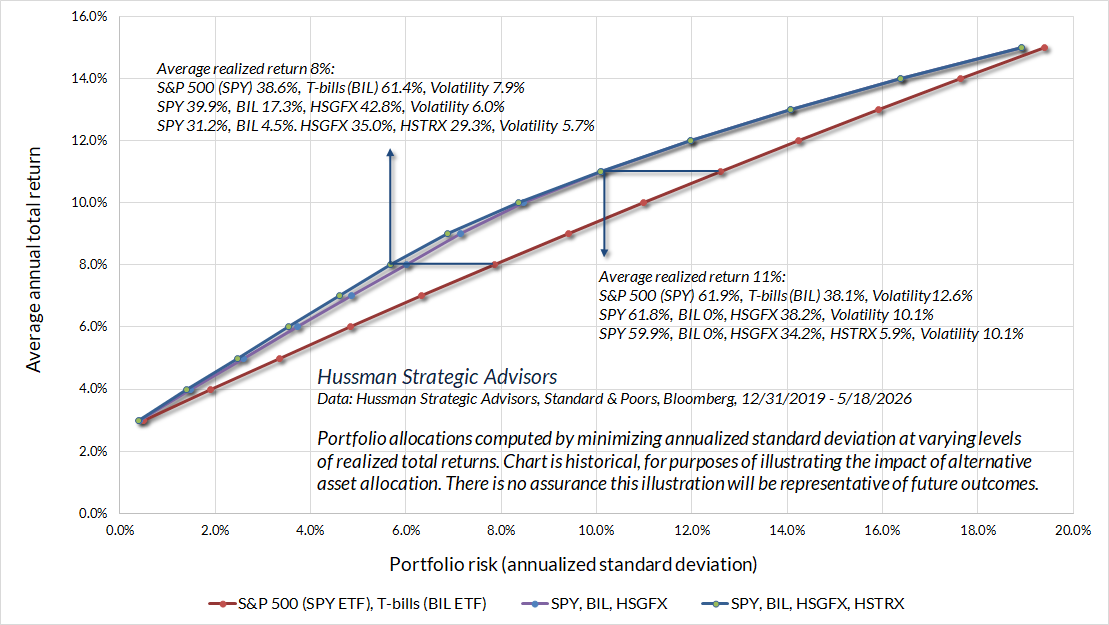
Now, to be clear, I haven’t been enthusiastic about the standalone returns of HSGFX during this period, and we’ve done an enormous amount of work to adapt our discipline to the point where we expect we can be happy even with a never-ending bubble. Still, for any allocation target less extreme than 100% in T-bills or 100% in the S&P 500 itself, the optimal allocations assign meaningful weight to HSGFX since 2019. This is the result of how HSGFX has interacted with the other assets during this period.
Importantly, if the interaction was due solely to our generally bearish outlook, the optimal allocations would instead have simply reduced the weight on the S&P 500 and increased the weight on cash. Instead, at least during the 2019-2026 period, holding HSGFX has allowed investors to reduce portfolio risk by taking a smaller position in cash (T-bills), and by selling less of the S&P 500 than they would have required otherwise to achieve any given expected return/risk target.
As always, past performance isn’t an assurance of future outcomes. However the future unfolds, there’s some comfort that, as part of an alternative investment sleeve, we’ve had a useful role in improving the return/risk tradeoff for investors even in a challenging period that we consider to be unrepresentative of our long-term expectations.
Looking ahead, our intent for Strategic Market Cycle Fund is to serve not only as an effective part of an “alternative sleeve” in the portfolios of our shareholders, but to restore its “standalone” profile of outperforming the S&P 500 with lower volatility – which was the case prior to the current bubble, and even through late-May of 2014. On that front, I expect that the hedging implementations we adopted in September 2024, and particularly in February/May of this year, will serve our discipline well – whether in a continuing bubble or in periods of collapse like 2000-2002 and 2007-2009.
The essential feature of a useful alternative asset isn’t that it’s unusual or exotic, but that its returns aren’t tightly linked to the risks that already dominate the portfolio. The value of an alternative asset comes from the way it interacts with the other assets in the portfolio. The lower the correlation, particularly if the asset tends to hold value or advance when the rest of the portfolio is under pressure, the more the asset can improve the expected return/risk profile of the portfolio – even if the ‘standalone’ return on that asset may be low.
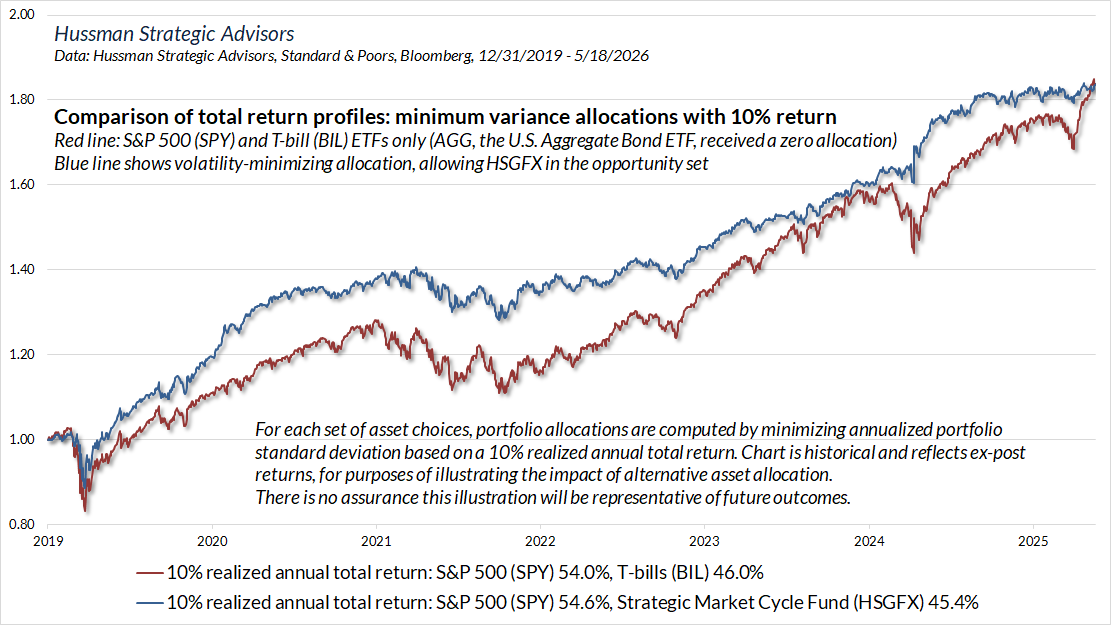
The chart below shows what this diversification impact looks like from a total return perspective. The red line in the chart below shows the minimum variance allocation between the S&P 500 (SPY) and T-bill (BIL) ETFs that would have resulted in a 10% annualized total return from 2019 through mid-May 2026 (again, the Bloomberg U.S. Aggregate Bond Index is assigned a zero allocation during this period). The blue line shows the minimum variance allocation when HSGFX is included in the investment opportunity set.
These illustrations, I hope, offer some sense of why “standalone” return is an inadequate consideration when choosing investments, and why it’s essential to consider how each asset interacts with the dominant risks that are already in the portfolio.
With valuations at record extremes, this may be a particularly important moment for investors to ask how much of their portfolio composition is directly or indirectly dominated by a small handful of mammoth companies at trading at extreme valuations.
The bottom line is that a sound investment “portfolio” is more than just a collection of seemingly desirable assets with high backward-looking returns. Ideally, a well-constructive portfolio takes investment valuations, volatility, and the interaction of various assets into account. Even for investors looking to reduce risk, going to cash may not be the ideal choice, and certain alternative assets may be a more effective part of the opportunity set.
Clearly, if investors set their expectations and return targets by extrapolating the past return of the best performing asset – which I fear more than a few investors are doing here – they may conclude that the “optimal” weighting is an all-in position at the most speculative edge of the market. My impression is that this will prove as much a recipe for deep disappointment as it has been in prior bubbles.
If we look at a given investment as a separate entity, rather than an interrelated part of a portfolio, we may not understand it yet. In 2017, we suspended taking bearish outlooks during periods of favorable market internals – even amid extreme valuations. If we look at a blended portfolio divided between the S&P 500 and our own investment discipline since that time, we find that the Sharpe ratio – the annualized return over-and-above T-bills, per unit of volatility – reaches its maximum at an allocation of about 55%/45%. Even though we didn’t enjoy the ‘upside capture’ that we expect going forward, an asset mix with an alternative sleeve, even since 2017, has had a higher return per unit of risk than the S&P 500 itself.
Needless to say, our effort is for the Sharpe ratio of a blended portfolio to reach its maximum at an even higher allocation to our investment discipline, and also a higher return than the S&P 500 itself, which was our norm in market cycles before the current bubble. That’s a work in progress, but then, having a broader scope for upside capture – even amid garbage and trap doors – is work that we can happily to put to use.
John P. Hussman, Ph.D., (More) Roses Amid Garbage and Trap Doors, May 2026
Investors should consider the investment objectives, strategies, risks, and expenses of mutual Funds carefully before investing. The Prospectus of each Fund contains this and other information – please read the Prospectus carefully before investing.
The charts above reflect purely historical, retrospective data, and do not depict the results of an actual portfolio. The allocations shown reflect the actual total returns of Hussman Strategic Market Cycle Fund (HSGFX), Hussman Strategic Total Return Fund (HSTRX), and the State Street SPDR S&P 500 and Bloomberg 1-3 Month T-Bill ETFs (SPY and BIL, respectively), but the allocations do not represent actual investment funds. There is no assurance that future market outcomes will match historical ones. Although returns for the individual Funds and ETFs reflect the impact of transaction costs and Fund expenses, comparative returns for the diversified portfolios shown here do not reflect the potential impact of taxes and rebalancing costs, and are for illustrative purposes only. While both mutual funds and exchange-traded funds (ETFs) pool investor money in securities, mutual funds are bought and sold directly through the fund company at end-of-day prices, whereas ETFs trade on stock exchanges throughout the day at fluctuating market prices. Current performance charts and data for the Hussman Funds, for standardized periods through the most recent month-end are available at the Fund’s website or by calling 1-800-487-7626.
The State Street SPDR S&P 500 ETF Trust (SPY) seeks to provide investment results that, before fees and expenses, correspond to the Standard & Poor’s 500 Index, a commonly recognized, capitalization-weighted index of 500 widely-held equity securities, designed to measure broad U.S. equity performance. Performance and expense information for standardized periods is available at the Fund’s website. The State Street SPDR Bloomberg 1-3 Month T-bill ETF (BIL) seeks to provide investment results that, before fees and expenses, correspond to the Bloomberg 1-3 Month U.S. Treasury Bill Index. Performance and expense information for standardized periods is available at the Fund’s website. The iShares U.S. Core U.S. Aggregate Bond ETF (AGG) seeks to track an index of U.S. investment grade bonds, with broad exposure to the total U.S. bond market. Performance and expense information for standardized periods is available at the Fund’s website. These funds were chosen based on length of history, total assets, and the correspondence of their investment returns with those of the S&P 500, 3-month Treasury bills, and the Bloomberg U.S. Aggregate Index, respectively.
Understanding the discipline – a review of adaptations to the bubble
The core of our discipline is to align our investment stance with prevailing, measurable, observable market conditions, and to change our investment stance as those conditions change. Among a very broad range of considerations, the central ones are valuations – which are enormously informative about long-term investment prospects despite having very little impact on near-term market prospects, and market internals – which are our most reliable gauge of investor psychology toward speculation or risk-aversion.
Across decades of market cycles in real-time, and across a century of historical data, attending to these two considerations alone was far more than enough to be quite happy, though it did rely on the bubbles having a certain impermanence to them. As the current bubble became more and more extreme, we progressively adopted adaptations that don’t rely on any future retreat in valuations. With the implementation we adopted in February/May of this year, I expect that we can be quite happy even if the current speculative bubble never ends, without leaving us vulnerable to the possibility that it could collapse tomorrow.
In a December 2022 portfolio note, I wrote “We adapted our discipline in late-2017 by abandoning our bearish response to previously reliable ‘limits’ to speculation, when our measures of market internals suggest speculative behavior among investors. We introduced additional adaptations in 2021 to lean more heavily to a constructive investment outlook – regardless of the level of valuations – when our measures of market internals are uniformly favorable. Still, the adaptations to our discipline do not encourage us to adopt a constructive market outlook in overvalued markets with ragged and divergent internals, which is the set of conditions we presently observe, as we did at the 2000, 2007, and 2020 market peaks.
Unlike our previous adaptations during this bubble, which were focused on expanding our flexibility during periods of favorable internals (even when valuations are extreme), our September 2024 hedging implementation was focused expanding our flexibility when market internals are unfavorable. That implementation was critical because it enabled us to vary the intensity of our bearish outlook much more effectively, even during periods of elevated valuations and ragged internals.
One final “pocket” of conditions remained. As I’ve discussed in recent months – see the February and May comments – what was missing from every adaptation prior to this year was a historically reliable and risk-managed way to identify constructive opportunities even in an ever-expanding bubble that combines both rich valuations and unfavorable market internals. A century of history had convinced us that constructive opportunities simply did not exist. What we’ve found is that these “roses amid garbage” have existed all along, across history, and indeed they account for about 20% of those “trap door” conditions – often “fast, furious” market advances that comprise a significant amount of cumulative return.
Not surprisingly, they bloom from patches of soil that are already ‘indeterminate’ – periods when our September 2024 implementation already reduces the intensity of our downside hedges. As an example – in certain conditions that one would otherwise classify as quite risky, there can be selloffs amid very high levels of bullish sentiment and low bearish sentiment; where the lopsided bullish sentiment acts not as a negative ‘contrary’ indicator, but as a signal that speculators simply can’t shake their optimism. These selloffs are followed by ‘fast, furious, prone-to-failure’ rallies with striking regularity. Now, there’s no assurance that future outcomes will be similar. But provided whatever market risk we take in these conditions continues to have a ‘safety net’ in case things break down, we can use index call options (or reduction of the short-call side of our hedges) to allow those ‘fast, furious, prone-to-failure’ rallies to become part of our return.
Keep in mind that our most important adaptations to the recent bubble have been in place for some time now. My impression is that the extreme valuations of recent years have obscured the fact that our discipline already classifies about 64% of historical periods as constructive or strongly bullish, including 40% of periods over the past decade.
– John P. Hussman, Ph.D., How I Learned to Love the Bubble (Even Before it Bursts), Feb 2026
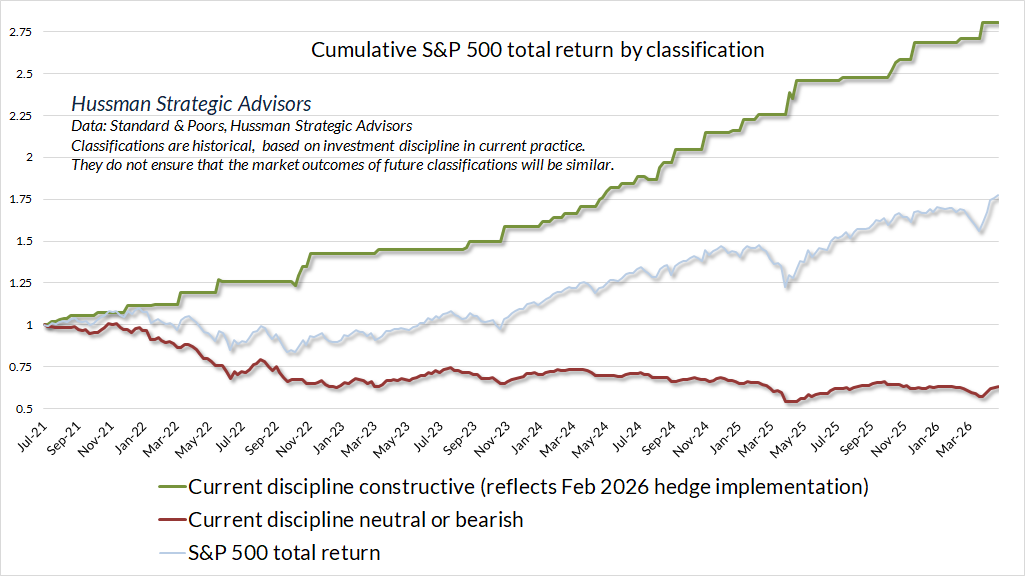
The chart below is reprinted from our early May comment. The green line shows the cumulative total return of the S&P 500 during periods since July 2021 – all amid unfavorable internals and extreme valuations – that our present discipline identifies as “constructive.” You’ll note that we’ve seen no “roses” in the past several weeks, but that’s another way of saying that we don’t need to chase this rally. We can be patient for the next set of constructive conditions to emerge. They’ve emerged about 19% of the time since 2021, but that’s been frequent enough to comprise the entire cumulative gain of the S&P 500 during this period. Indeed, in two thirds of 6-week periods since 2021, there has been at least one week classified as “constructive.”
Moreover, this 19% subset of periods since 2021 comprises the entire cumulative gain in the Nasdaq 100 over the full period. This is encouraging because it allows us to embrace even the possibility of a continued bubble in the technology sector without abandoning the beneficial discipline of our stock selection approach. I expect it will be more than enough simply to shift our hedges, still with a safety net, in this relatively limited subset of periods.
Because most of market history has featured reasonable valuations, favorable market internals, or both, we see an even higher frequency of constructive classifications in data since 2000, 1940 and 1929, with similar “upside capture” even during bubble periods. There’s no assurance that future market conditions will reflect the same outcomes, but we can reasonably expect that there will be ample points in the future to be constructive in a disciplined, historically-informed, risk-conscious way – even if this particular bubble never bursts.
Across history, whether we look back to 2000, 1940 or even 1928, we find these “roses in the garbage” exist. They’ve existed all along. It’s just that prior bubbles devolved quickly enough that it was enough to take our ball and go home as soon as market internals deteriorated – indeed, it was enough to leave the party as soon as we observed sufficiently “overvalued, overbought, overbullish” conditions.
The thing that’s been “different” about this bubble has been the unprecedented amplification of speculation, first by monetary policy, then fiscal policy, and finally by novel technology that may – or may not – have reached the point of systemically destabilizing overinvestment. From the standpoint of our own discipline, we’ve had to extend our strategic flexibility to every sort of condition.
See, even in conditions we’ve typically classified as “trap doors” and “garbage”, constructive opportunities can exist – not because of what’s happening in the economy, in monetary policy, or in market valuations. They exist because of what’s happening in the heads of investors, and we can quantify that through measures like investor sentiment, market volatility, credit spreads, and key components that “feed into” our main gauge of market internals – even when broad internals themselves are unfavorable.
“Constructive” instances like this often take the form of brief, explosive advances following periods of market weakness. Taken as a group, their cumulative impact can be striking, though we do require a safety net if market internals are unfavorable. Again, the question of whether a market pullback follows through to further downside, or whether it leads to a “fast, furious clearing rally”, often has nothing to do with specific news, and everything to do with what’s happening in the heads of investors. That’s essentially what we’re quantifying.
Adopting a ‘constructive’ stance when valuations and market internals are unfavorable is not about trying to ‘jump into the market’ or ‘catch’ advances. Rather, it’s about identifying brief periods that are so hostile to a hard-negative hedge position that it makes sense to remove the component of the hedge that ‘fights the market’ and places a cap on upside gains, while still maintaining the component of the hedge that acts as a safety net against significant market losses.
Conditional probabilities
Recall that whatever market conditions may be, it can help to look at the probability distribution of returns, “conditional” on some important factor, or a combination of them. We can then ask questions like “What’s the profile of likely market returns and risk, given this or that set of conditions?” That’s what we call the “conditional” probability distribution. In nearly every case, the distribution includes both positive and negative outcomes.
That’s another way of saying that the “constructive” classifications we identify aren’t always accompanied by market advances. “Constructive” doesn’t necessarily mean “bullish” or “unhedged.” Indeed, when our broad gauge of market internals is unfavorable, we always have a safety net, particularly at rich valuations.
One can think of the “roses” as shifting the “return/risk profile” the of the market. The probability distribution of weekly returns skews toward “fast, furious” advances of several percent. These tend to dominate periodic losses. Conversely, the “trap door” conditions that remain classified as “bearish” skew even more strongly toward losses.
The bell curves below show fitted probability distributions of actual weekly S&P 500 total returns since 1940 in periods when our key gauge of market internals has been unfavorable. The chart is historical, for expositional purposes, and as usual, there’s no assurance that future market classifications will have the same profile.
The blue curve shows the distribution of weekly S&P 500 total returns in all periods when market internals have been unfavorable. The green curve shows the distribution in the subset of these periods that we can classify as “constructive”, despite unfavorable market internals, based on measurable and observable market conditions. These classifications reflect the February/May implementations that we’ve adopted into practice. The red curve shows the distribution in periods of unfavorable market internals that our present discipline still classifies as “bearish.”
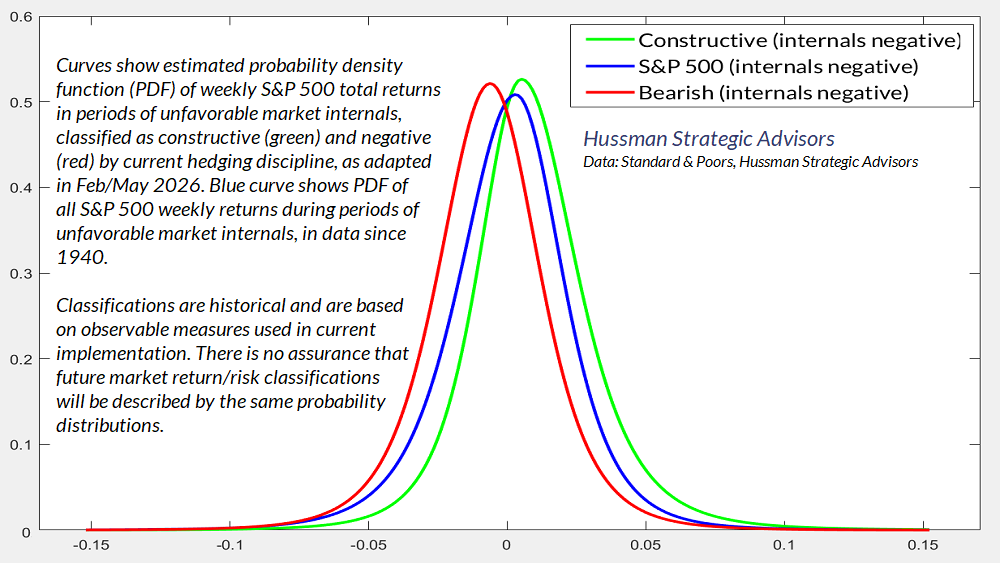
Notably, all of these estimated return/risk classifications include both positive and negative returns. It’s the distribution that we care about, because that’s what we align our investment outlook with, period by period, as observable market conditions change over time. When market internals are unfavorable, and particularly when valuations are extreme, even a constructive outlook requires a safety net. Still, we expect that it will be enormously helpful to maintain that defense without denying the existence of roses altogether.
Loving the bubble doesn’t mean taking risks that rely on the bubble to be permanent, or that assume it won’t immediately collapse. Instead, it means finding more flexibility in our outlook, ideally with a safety net in periods we’re able to be constructive, and apply that flexibility to a larger set of constructive instances. We can look ahead without fearing a continued bubble, without fearing a market crash, knowing that we’ve got a risk-conscious discipline in place regardless of market outcomes.
A closing thought. Whatever situation or challenge we encounter, whether in ourselves, our relationships, our jobs, or the world, it often happens that our notions and ideas – the rigid boxes we use to separate this versus that, us versus them, like versus dislike – may be far too coarse to contain reality.
Nothing exists by itself alone. Everything is made of countless causes and conditions – less “solid” and more “interrelated” than we may realize. Looking with care at those causes and conditions, in ourselves, in others, in our situation, we often see things more clearly, with more empathy, without confusing the person or the situation with the causes and conditions that brought the situation about. The Buddha called it the wisdom of universal sameness, of equality, of nondiscrimination. It applies to everything. Even, as it turns out, to a speculative bubble.
Something to consider in other aspects of our lives as well.
Keep Me Informed
Please enter your email address to be notified of new content, including market commentary and special updates.
Thank you for your interest in the Hussman Funds.
100% Spam-free. No list sharing. No solicitations. Opt-out anytime with one click.
By submitting this form, you consent to receive news and commentary, at no cost, from Hussman Strategic Advisors, News & Commentary, Cincinnati OH, 45246. https://www.hussmanfunds.com. You can revoke your consent to receive emails at any time by clicking the unsubscribe link at the bottom of every email. Emails are serviced by Constant Contact.
The foregoing comments represent the general investment analysis and economic views of the Advisor, and are provided solely for the purpose of information, instruction and discourse.
Prospectuses for the Hussman Strategic Market Cycle Fund, the Hussman Strategic Total Return Fund, and the Hussman Strategic Allocation Fund, as well as Fund reports and other information, are available by clicking Prospectus & Reports under “The Funds” menu button on any page of this website.
The S&P 500 Index is a commonly recognized, capitalization-weighted index of 500 widely-held equity securities, designed to measure broad U.S. equity performance. The Bloomberg U.S. Aggregate Bond Index is made up of the Bloomberg U.S. Government/Corporate Bond Index, Mortgage-Backed Securities Index, and Asset-Backed Securities Index, including securities that are of investment grade quality or better, have at least one year to maturity, and have an outstanding par value of at least $100 million. The Bloomberg US EQ:FI 60:40 Index is designed to measure cross-asset market performance in the U.S. The index rebalances monthly to 60% equities and 40% fixed income. The equity and fixed income allocation is represented by Bloomberg U.S. Large Cap Index and Bloomberg U.S. Aggregate Index. You cannot invest directly in an index.
Estimates of prospective return and risk for equities, bonds, and other financial markets are forward-looking statements based the analysis and reasonable beliefs of Hussman Strategic Advisors. They are not a guarantee of future performance, and are not indicative of the prospective returns of any of the Hussman Funds. Actual returns may differ substantially from the estimates provided. Estimates of prospective long-term returns for the S&P 500 reflect our standard valuation methodology, focusing on the relationship between current market prices and earnings, dividends and other fundamentals, adjusted for variability over the economic cycle. Further details relating to MarketCap/GVA (the ratio of nonfinancial market capitalization to gross-value added, including estimated foreign revenues) and our Margin-Adjusted P/E (MAPE) can be found in the Market Comment Archive under the Knowledge Center tab of this website. MarketCap/GVA: Hussman 05/18/15. MAPE: Hussman 05/05/14, Hussman 09/04/17.