
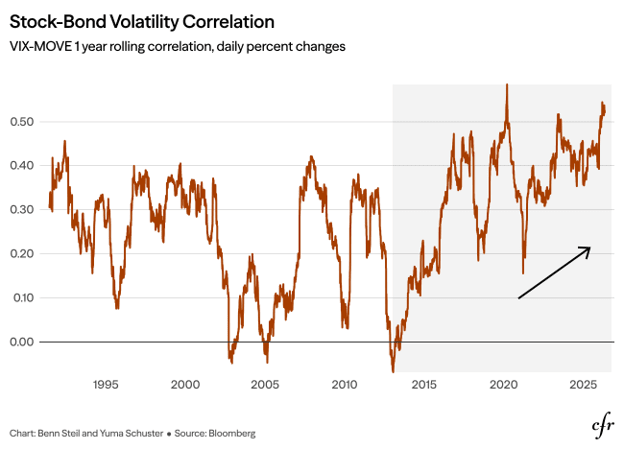
As the chart above shows, before 2013 the VIX, which measures expected volatility in equity markets, and the MOVE, its equivalent for Treasuries, moved in tandem only during acute crises. Correlation between the two reached roughly 0.4 during the dot-com bust and again during the global financial crisis, as shared macroeconomic uncertainty drove both markets simultaneously. Once each episode passed and idiosyncratic, asset-specific information reasserted itself, correlation fell back toward zero.