

Updated as of: April 6, 2026
Mutual funds have long been a staple in portfolios for their ability to deliver diversification, professional management, and tailored exposure to specific sectors or asset classes.
Evaluating long-term performance is essential for identifying funds that demonstrate resilience, consistent returns, and strong management practices. This article highlights the best-performing mutual funds over various lookback periods in the last decade.
To create this list, we analyzed the entire mutual fund universe using the YCharts Fund Screener to find the best-performing US-domiciled equity mutual funds over 1-year, 3-year, 5-year, and 10-year timeframes. (Leveraged and inverse mutual funds as well as those in the alternative currency strategy and options arbitrage strategy peer groups were excluded to focus on long-term investment vehicles that align with broader financial planning goals)
The following best-performing mutual funds are shown with total return, expense ratio and AUM and metrics to showcase recent trends and shifts. All performance data is standardized to ensure comparability across funds and lookback periods.
Looking for lists of the best performing ETFs? Check out our analysis on the Best Performing ETFs here.
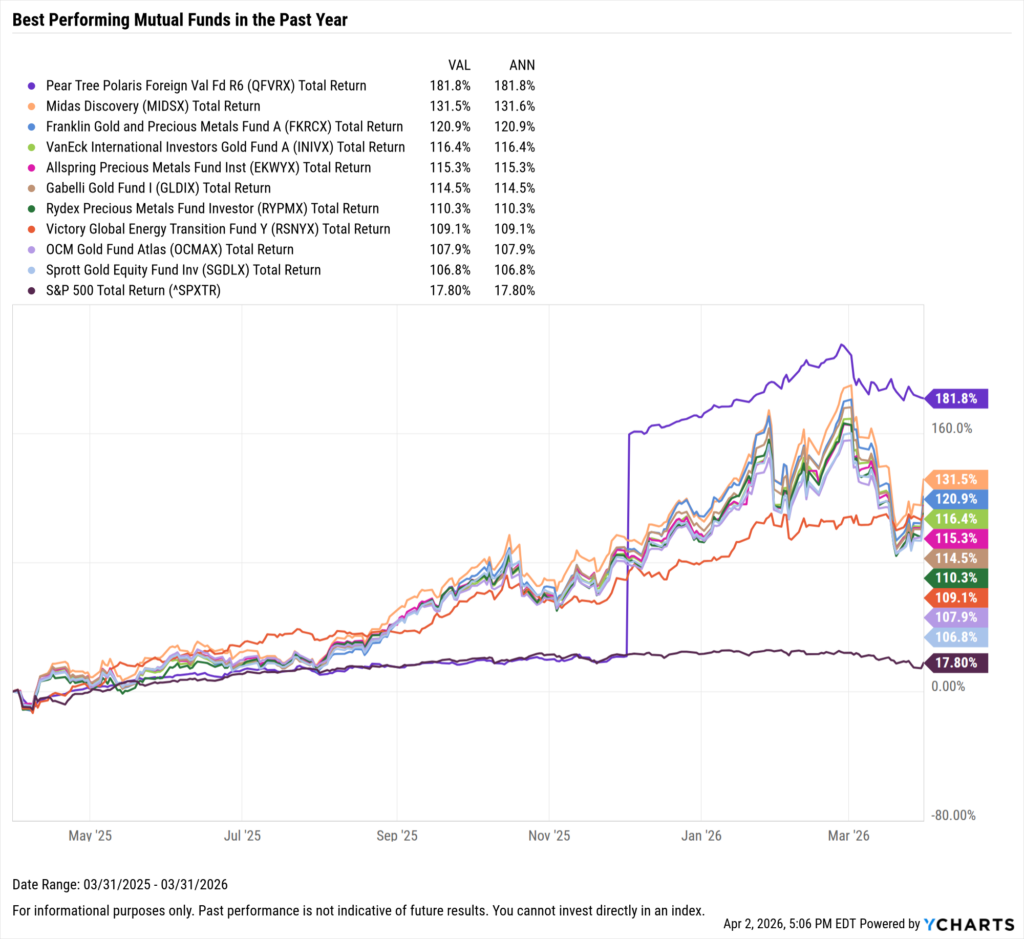
Best Performing Mutual Funds in the Last Year
These are the top-performing mutual funds over the past year, as of March 31, 2026.
Start a Free Trial to See Full Rankings | View & Modify in Fund Screener
Download Visual | Modify in YCharts
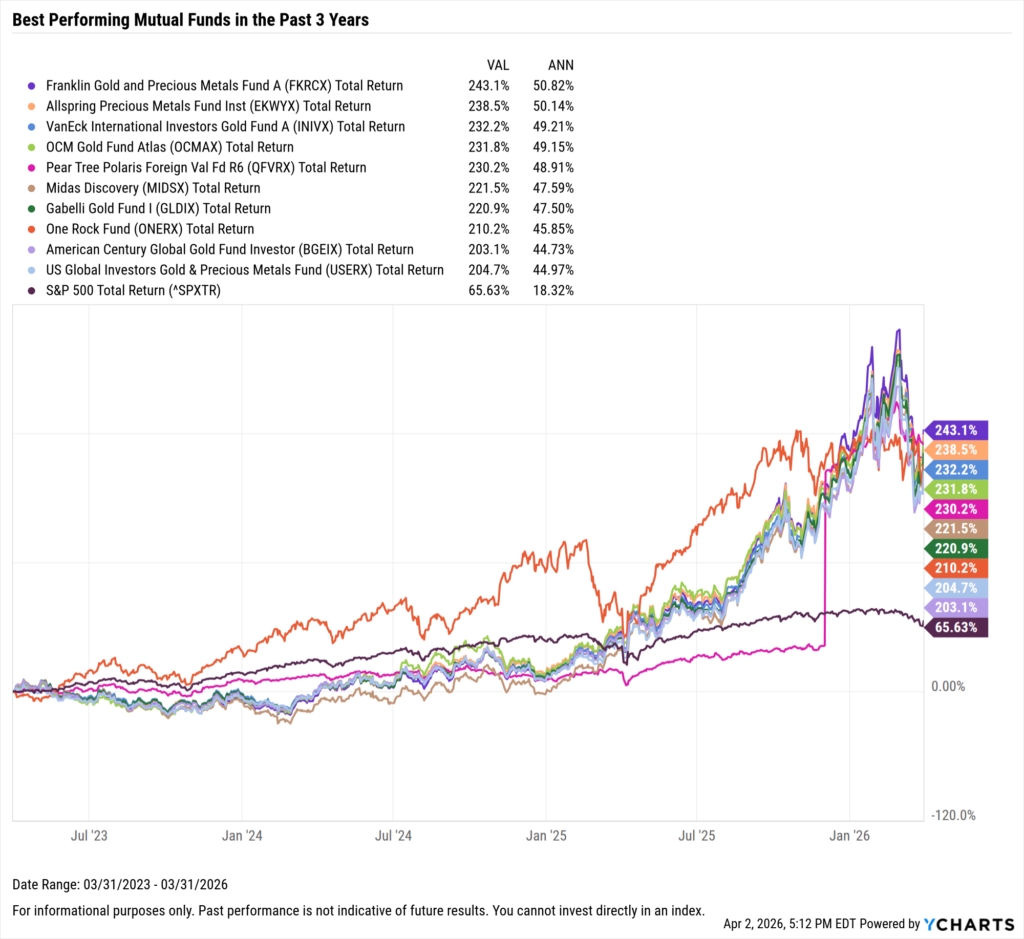
Best Performing Mutual Funds in the Last 3 Years
These are the top-performing mutual funds on an annualized basis between April 1st, 2023 and March 31, 2026.
Start a Free Trial to See Full Rankings | View & Modify in Fund Screener
Download Visual | Modify in YCharts
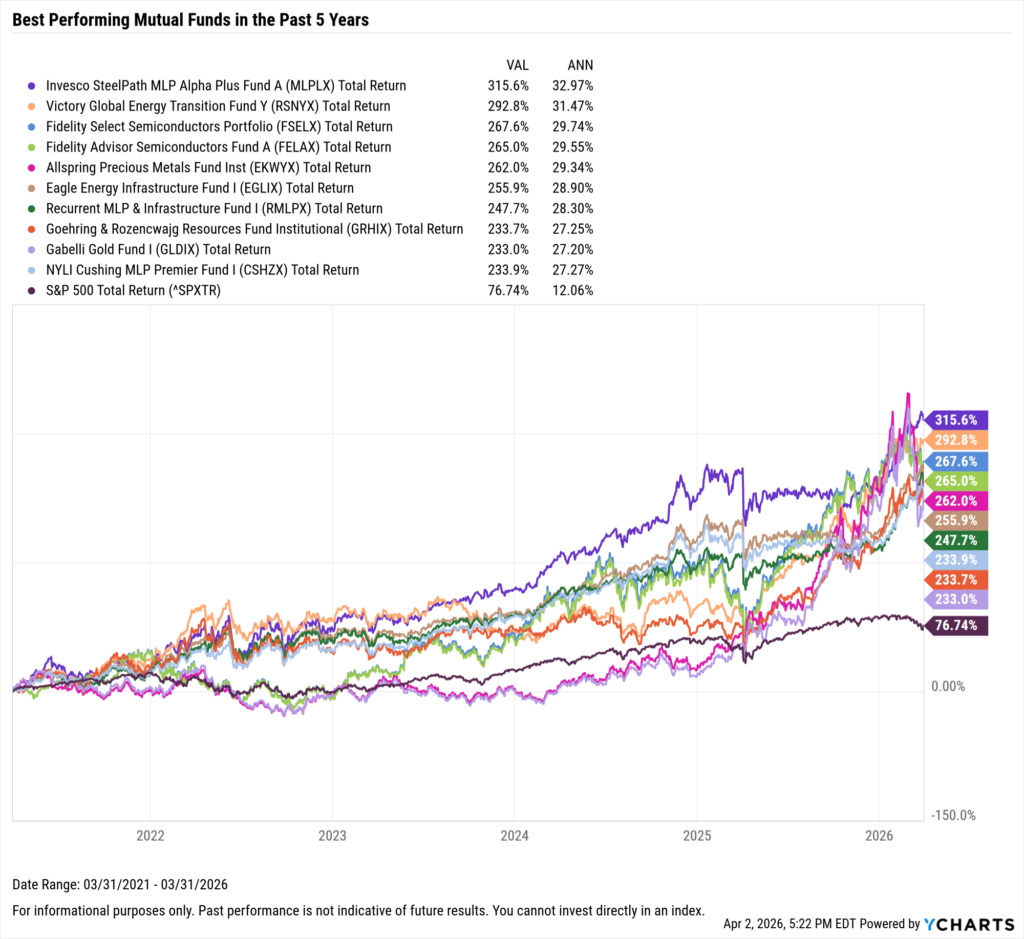
Best Performing Mutual Funds in the Last 5 Years
These are the top-performing mutual funds on an annualized basis between April 1, 2021 and March 31, 2026.
Start a Free Trial to See Full Rankings | View & Modify in Fund Screener
Download Visual | Modify in YCharts
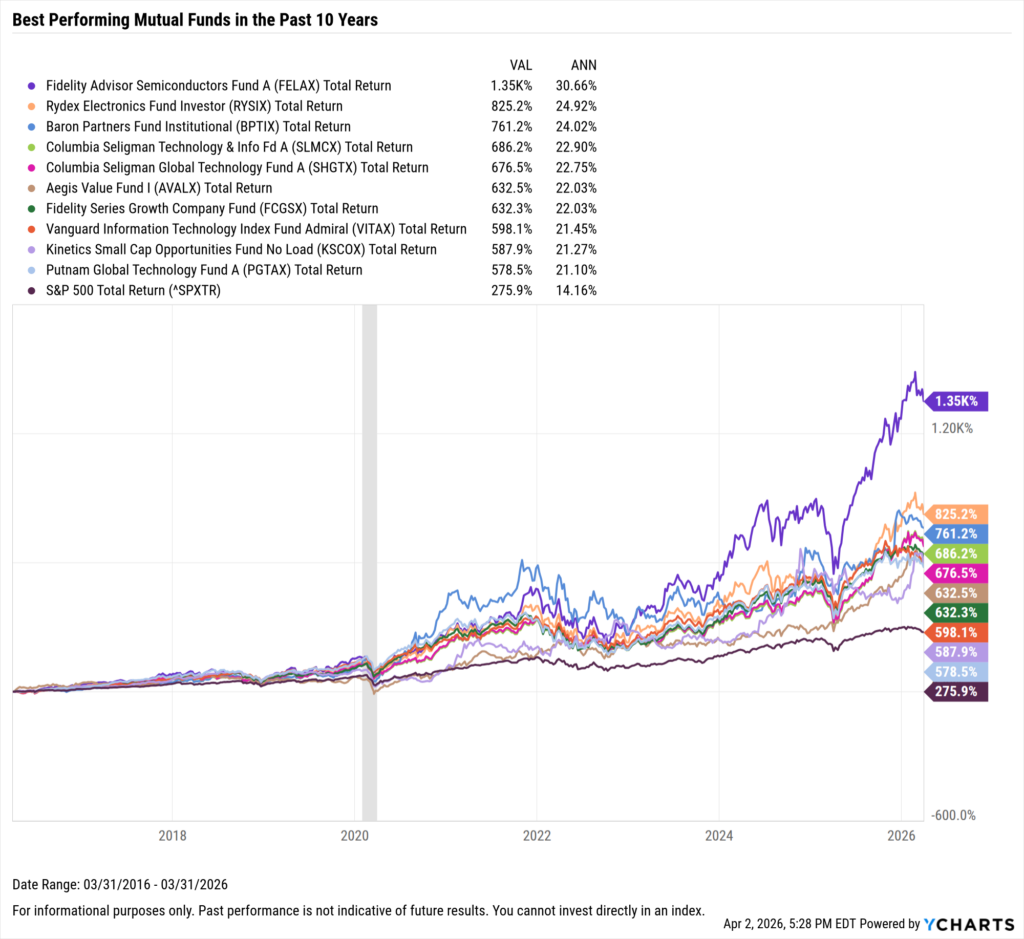
Best Performing Mutual Funds in the Last 10 Years
These are the top-performing mutual funds on an annualized basis between April 1, 2016 and March 31, 2026.
Start a Free Trial to See Full Rankings | View & Modify in Fund Screener
Download Visual | Modify in YCharts
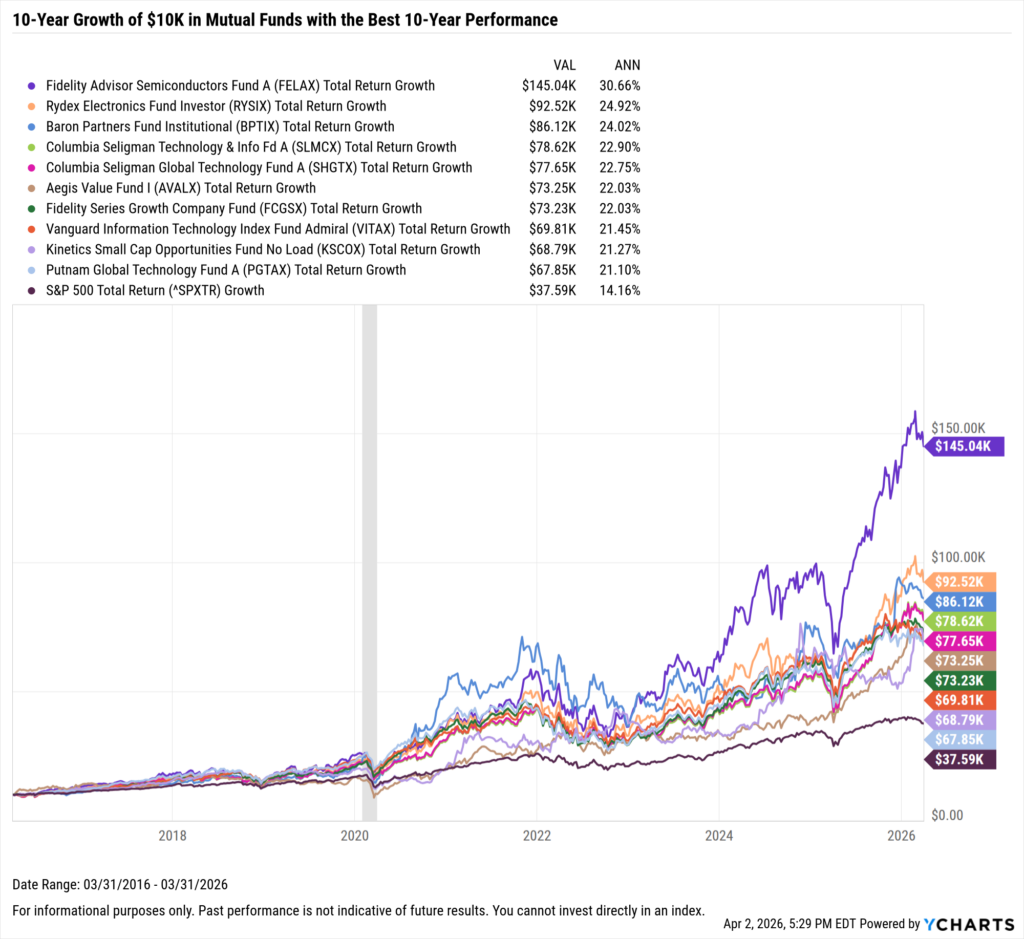
What Was the Growth of $10,000 in the Top Bond Mutual Funds Over the Last 10 Years?
If you invested $10,000 10 years ago into any of the ten best-performing mutual funds over the last 10 years, your balance today would be no less than $67K.
The two best-performing mutual funds in the last 10 years were semiconductor funds. A $10,000 investment into the Fidelity Advisor Semiconductors Fund (FELAX) would be worth $145,000 today. Behind the Fidelity Advisor Semiconductors Fund was the Rydex Electronics Fund Investor mutual fund (RYSIX); investing $10,000 into RYSIX back in 2016 would’ve turned into $92,520.
Download Visual | Modify in YCharts
Whenever you’re ready, here’s how YCharts can help you:
1. Looking to Move On From Your Investment Research and Analytics Platform?
2. Want to test out YCharts for free?
Start a no-risk 7-Day Free Trial.
3. Sign up for a copy of our Fund Flows Report and Visual Deck to stay on top of mutual fund trends:
Sign up to recieve a copy of our monthly Fund Flows Report:
Disclaimer
©2026 YCharts, Inc. All Rights Reserved. YCharts, Inc. (“YCharts”) is not registered with the U.S. Securities and Exchange Commission (or with the securities regulatory authority or body of any state or any other jurisdiction) as an investment adviser, broker-dealer or in any other capacity, and does not purport to provide investment advice or make investment recommendations. This report has been generated through application of the analytical tools and data provided through ycharts.com and is intended solely to assist you or your investment or other adviser(s) in conducting investment research. You should not construe this report as an offer to buy or sell, as a solicitation of an offer to buy or sell, or as a recommendation to buy, sell, hold or trade, any security or other financial instrument. For further information regarding your use of this report, please go to: ycharts.com/about/disclosure.