
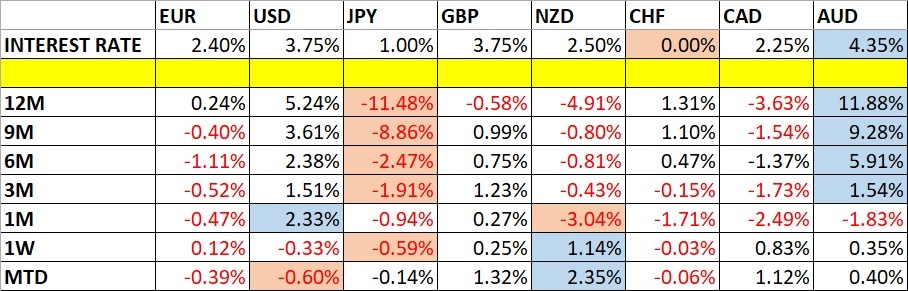
Fundamental Backdrop and Market Sentiment
I wrote on 12th July that the best trades for the week would be:
-
Long of the USD/JPY currency pair. This produced a gain of 0.43% over the week.
-
Short of the EUR/USD currency pair. This produced a loss of 0.20% over the week.
The total gain of 0.23% averages to 0.12% per asset.
A summary of last week’s most important data in the market:
-
US CPI (inflation) – this came in notably lower than expected, it was expected to contract by 0.1% month-on-month but contracted by 0.4%, creating a drop in the annualized rate from 4.2% to 3.5%, which gave US stock markets a temporary boost which they were unable to hold onto.
-
US PPI – continuing the theme, this also came in lower than expected, contracting month-on-month by 0.3%, when it was expected not to change.
-
Fed Chair Warsh Testifies to Congress – his testimony’s harsh rhetoric on inflation was taken as hawkish, despite the more dovish data.
-
Bank of Canada Policy Meeting – the Bank held rates and the meeting was mostly interpreted as very slightly dovish.
-
UK GDP – this was expected to remain unchanged month-on-month but ticked a fraction higher.
The big stories last week were the softer US inflation-related data, and the deterioration of relations between the USA and Iran to something approaching war, with the completed Memorandum of Understanding now more or less disowned by both parties.
The unexpectedly soft US CPI and PPI data will relieve the pressure on the Fed to hike rates, although one hike of 0.25% later this year is still seen as probable. What this kind of soft data typically does is give US stock markets a boost and trigger a selloff in the US Dollar on the prospect of lower interest rates. Yet oddly, although these were temporary effects of the data, the week ended with major US equity indices lower. The US Dollar lost value as would be expected.
This may be explained by a few factors. Maybe the stock market rally is just too over extended, and prices need to come down, especially in tech and AI (note how much worse a chart of the NASDAQ 100 Index looks than a chart of the broader S&P 500 Index). Maybe Warsh’s hawkish testimony before Congress negated the soft data. Maybe – this brings me to the second big story of last week – the seven consecutive nights of exchanges of fire between the USA and Iran, including fire on several Gulf states by Iran, is weighing on risk sentiment. A return to full-scale war is hard to imagine, but it could happen. It is certainly true, as I have been saying here for months, that the prospect of a “good deal” for the USA with Iran is a pipe dream, and unfortunately President Trump and even more so Vice President Vance have been hitting the pipe a lot in recent months. Vance’s political future is now potentially tied to Iran’s behaviour, but that won’t stop President Trump from ordering a return to war if he feels he must.
The USA/Iran situation is continuing to affect the price of Crude Oil, which rose again last week to close above $80 per barrel.
The Week Ahead: Key Data and Events to Watch
Next week looks relatively light but includes some significant data items. The coming week’s most important data points, in order of likely importance, are:
-
European Central Bank Policy Meeting
-
UK CPI data
-
Canadian CPI data
-
New Zealand CPI data
-
Australian Unemployment Rate
-
UK Unemployment Claims
It is a public holiday in Japan on Monday.
Monthly Forex Forecast: July 2026 Overview
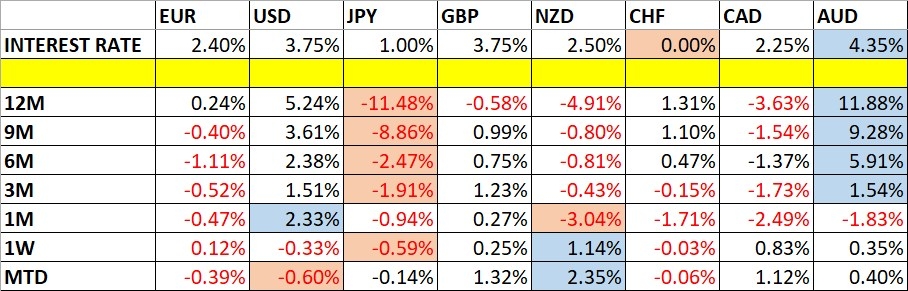
Currency Price Changes and Interest Rates
For the month of July, I forecasted that the EUR/USD currency pair will decline in value, and the USD/JPY currency pair will rise in value. The performance so far is:

Weekly Forecast 19th July 2026
Last week, I made no weekly forecast.
This week, I again make no forecast, as there were no exceptional price movements last week.
Volatility was unchanged last week, with 19% of the notable currency pairs and crosses moving by more than 1% in value. Next week’s volatility is likely to remain at a similar level, although it might be higher.
You can trade these forecasts in a real or demo Forex brokerage account.
Technical Overview and Key Levels
Key Support and Resistance on Major FX Pairs
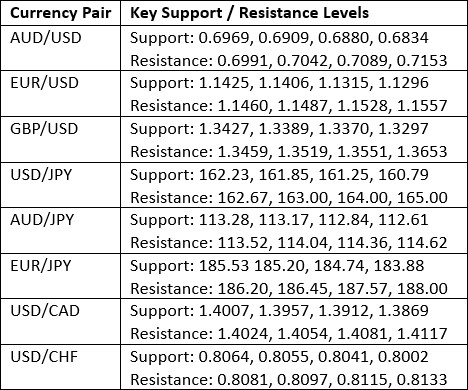
Key Support and Resistance Levels
US Dollar Index
The US Dollar printed a bearish outside engulfing candlestick last week, continuing the downwards price movement following the attempted but failed breakout to a new 13-month high above the key long-term resistance level at 101.39.
Although the candlestick is technically a bearish candlestick, the real body is not large, and there is a large lower wick, so there does not seem to be a great deal of bearish conviction within this price movement. The price also seems to have found some support at 100.00 which could become technically significant. However, it was supported by lower-than-expected US CPI and PPI data which lowers the hawkish pressure on the Fed somewhat.
A valid long-term bullish trend has clearly been established, with the price above its levels of both 3 months ago and 6 months ago, but its failure to break above resistance calls it into serious doubt.
I usually do not like to trade against a long-term trend, but I think that it makes sense to be comfortable with short USD over the coming week, at least against certain currencies that are not even weaker like the Japanese Yen.
I think the greenback will continue to trade lower and sink back into the area of former consolidation below 100.00
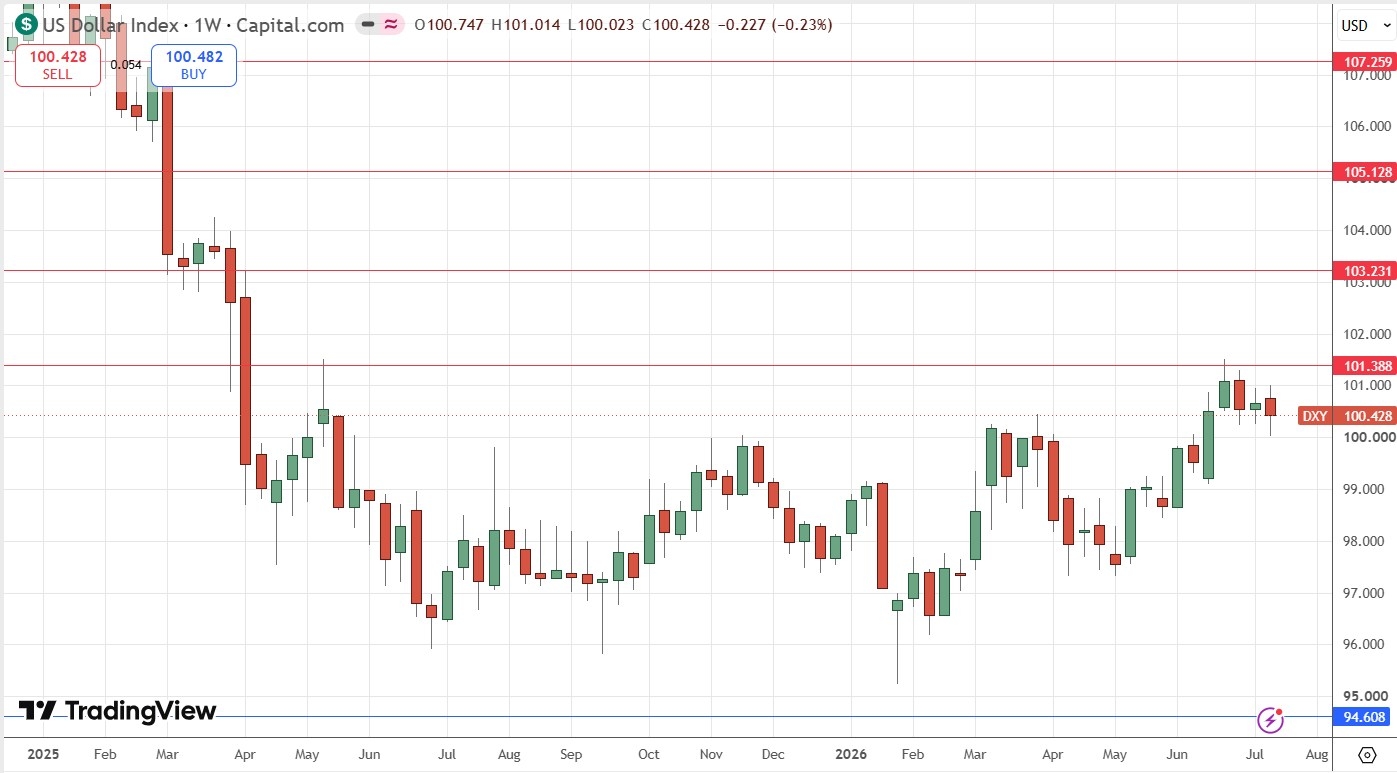
US Dollar Index Weekly Price Chart
USD/JPY
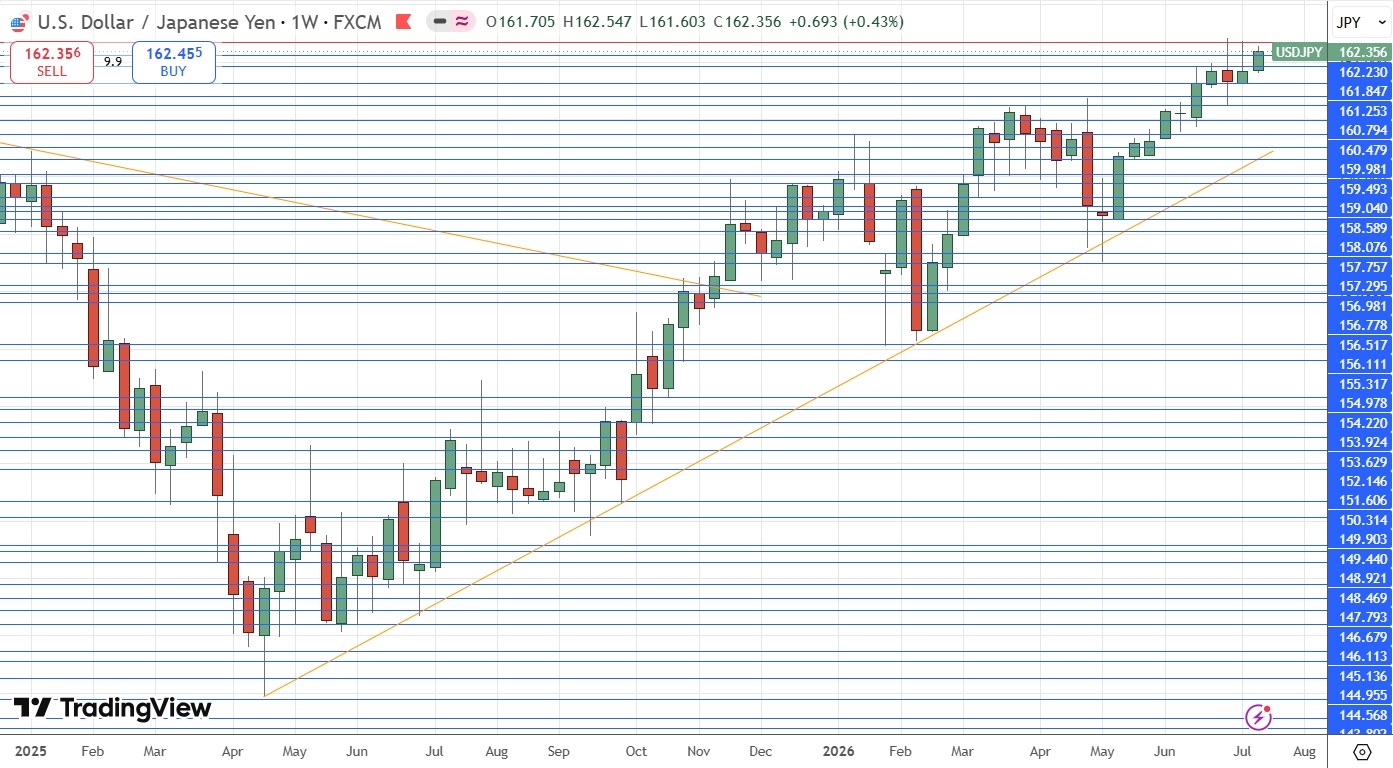
The USD/JPY currency pair was unable to reach a new 39-year high price last week, although it did produce a bullish inside candlestick which made the highest weekly close in almost four decades. All the signs are bullish, but the problem for bulls is that the US Dollar is not advancing – the gains here are due to the endless weakness of the Japanese Yen, due to the massive amount of Japanese debt.
The price is not far from the record high and there is clearly a very long-term bullish trend in force.
I am long of this currency pair, as a trend trader. I am very comfortable being long of this currency pair – as a longer-term trend trade, this pair still looks good. Look at that supportive ascending trend line shown in the price chart below which stretches all the way back to April 2025.
This currency pair tends to trend more reliably than the Yen crosses but crosses like NZD/JPY and GBP/JPY are performing more bullishly and strongly than this pair, so shorter-term traders might be wise to look for long trades there instead of here.
USD/JPY Weekly Price Chart
NZD/JPY
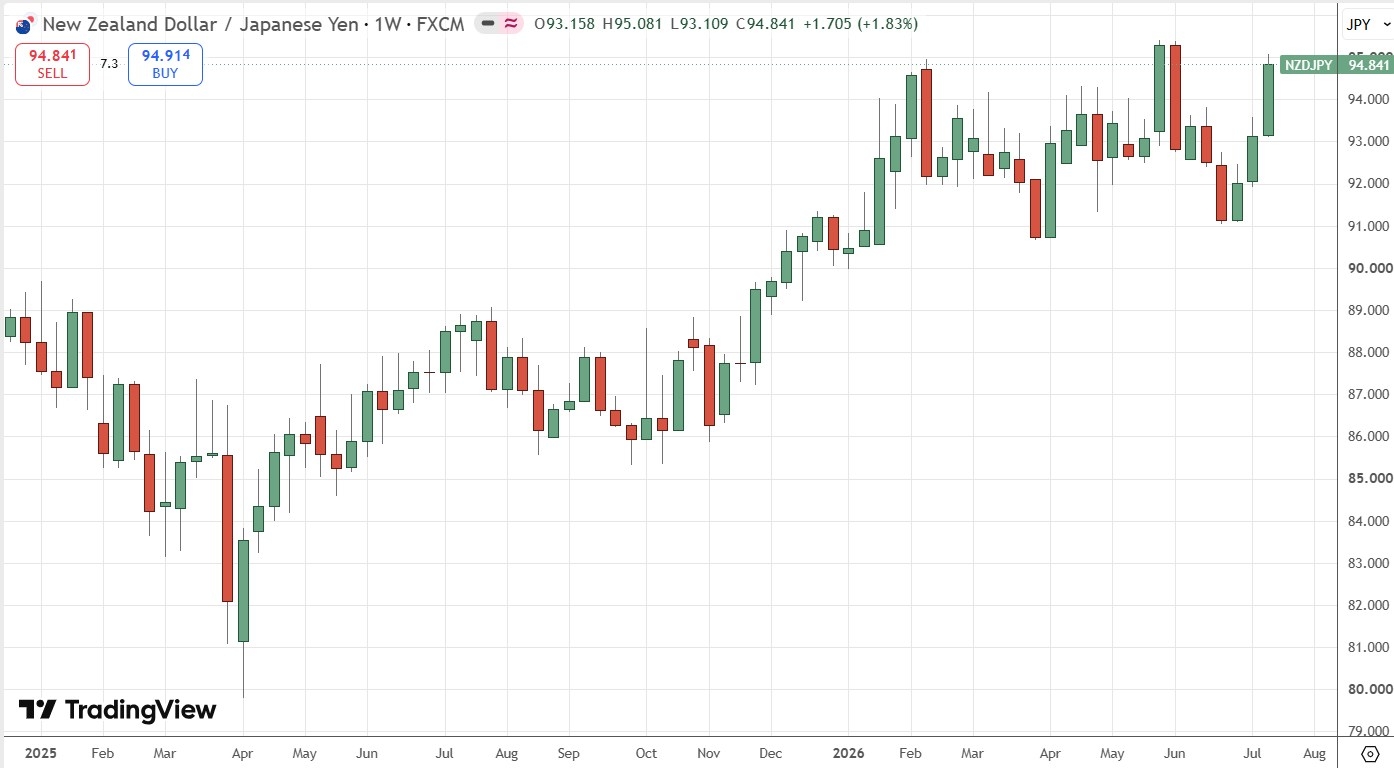
I wrote above while covering the USD/JPY currency pair about the long-term weakness in the Japanese Yen, while the US Dollar is maybe not the best currency to be long of. The best-performing major currency last week was the New Zealand Dollar, and the price chart below has shown steady movement higher over the past three weeks in the NZD/JPY, especially over the last week.
The price is near the long term high. The Kiwi’s strength is due to continuing hawkish signals on monetary policy from the RBNZ and strong domestic manufacturing data.
Day traders might be interested in looking for long trades in this currency cross, especially if they are trading during the Asian session.
NZD/JPU Weekly Price Chart
NASDAQ 100 Index
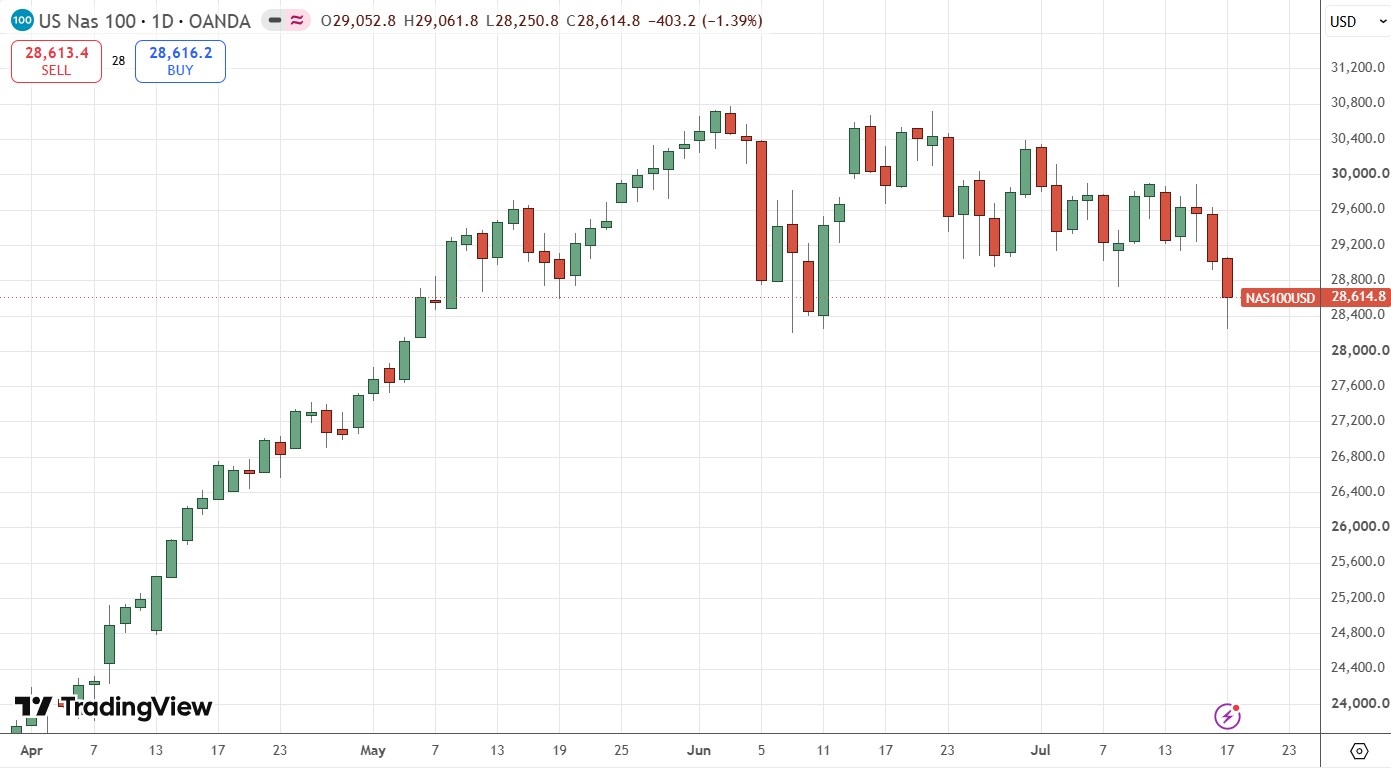
US stock markets have been starting to look weak, and there is no index that looks weaker than this one. Technically, the daily price chart below shows a broad topping chart pattern which suggests that a sharp downwards move is coming. Another factor in this is the fact that the price moved up into its current area very quickly, so there is no technical reason why it cannot also fall back to where it came from very quickly.
A major reason behind this is the massive AI boom which has seen AI and chip stocks make extremely huge gains within just a few months. This sector looks very overbought and could drag the entire tech sector and even the whole stock market down with it.
I don’t like to short equity indices, especially not US equity indices, but I can see this Index falling by quite a lot more, and when that downwards move stabilizes, there could be a buying opportunity.
If you have been long here for some time, it might be smart to consider taking profit. The price closed very near its two-month low.
NASDAQ 100 Index Daily Price Chart
Gold
Gold had a bullish candlestick last week, and the fact that the price has not made a new long-term low for three weeks is likely to give bulls a glimmer of hope. The descending trend line is still suppressing the price, but there are initial signs that things might be about to change.
If you are thinking of buying, it will likely be wiser once the trend line I mentioned is decisively broken. Next week, the higher descending trend line will be located at about $4,131, confluent with an obvious horizontal resistance level which enhances its importance.
There is also an inner descending trend line, which adds bearishness to the picture. Another bearish factor is that Silver, with which Gold is often highly positively correlated, has made a new multi-month low price and looks even more bearish than Gold.
I do not short commodities, but if I did, a short here would be attractive to me once the price closed with a strong bearish daily candlestick at a new multi-month low price. Until the Fed changes their hawkish rhetoric on inflation, I doubt Gold will be able to make a serious upwards move.
Gold Daily Price Chart
WTI Crude Oil Futures
WTI Crude Oil had its second consecutive up week, after reaching key support at $67.11 three weeks ago which is classic “stairstep” support as it previously acted as resistance. This was the area the price was trading in before the USA / Iran war started on 28th February earlier this year.
The ceasefire between the USA and Iran continued to deteriorate substantially last week, with seven consecutive nights of exchanges of fire between the USA and Iran. Iran has also attacked, and continues to attack, several crude oil producing Gulf states. Both the USA and Iran have effectively stated that they no longer feel bound by the MoU mandating the ceasefire.
The Strait of Hormuz is apparently effectively closed according to publicly available information, and if this does not change quickly, the price of crude oil is going to trade higher when markets open this week. President Trump may let it rise further, but he will be placed in a major dilemma if the Iranians can cause enough impact over Hormuz to threaten to reignite crude oil price shock inflationary fears over the global economy.
I am not sure how much further it will go, because when Trump decides it has gone too high he might suddenly reverse course or make some declaration which could send the price suddenly lower, so it might be dangerous to trade.
Going long here might best be done by day trading, so you are in the market for only a short time.
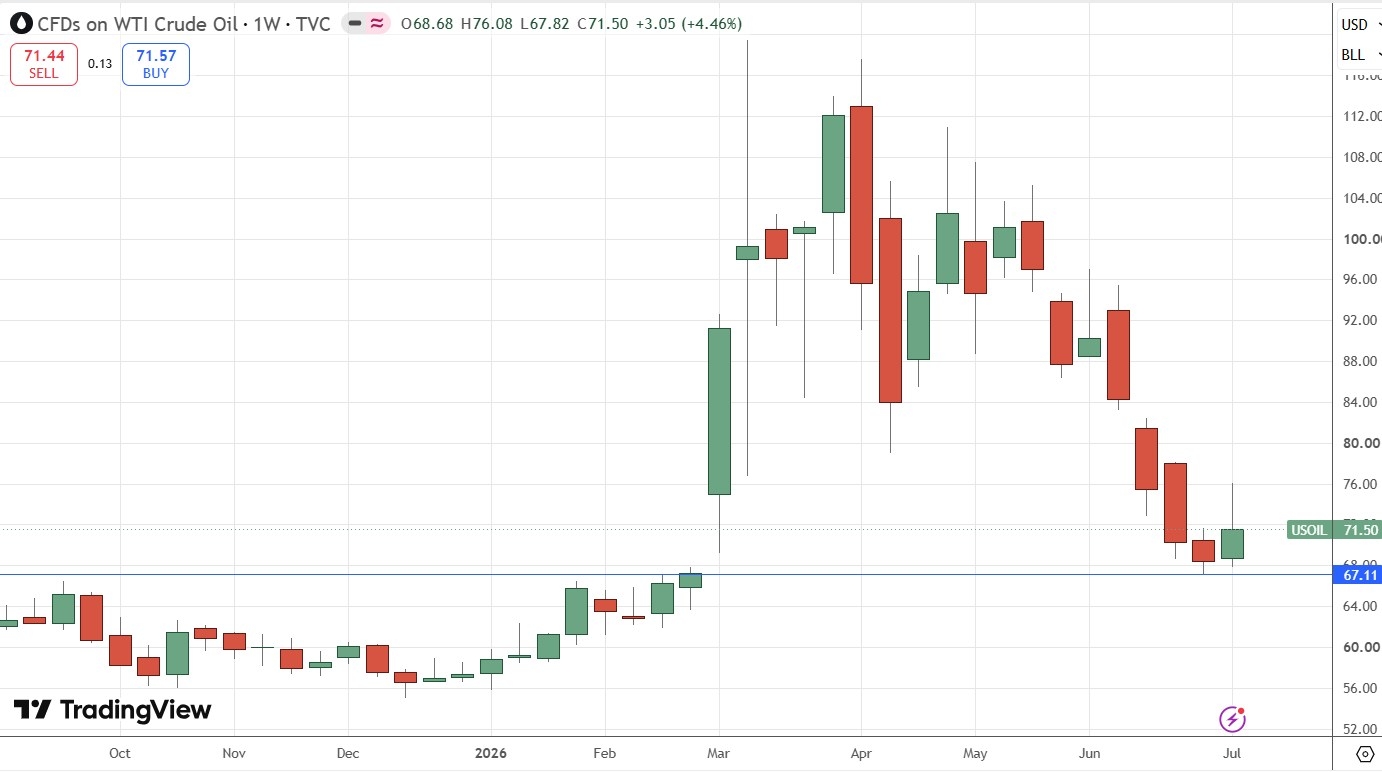
WTI Crude Oil Spot Daily Price Chart
Bottom Line
I see the best trades this week as:
-
Long of the USD/JPY currency pair.
-
Short of the EUR/USD currency pair.
Ready to trade our Forex weekly forecast? Check out our list of the top 10 Forex brokers.