

The City of Orlando is a Florida municipal corporation that was founded in 1875, and has an estimated population of 335,066 living within an area of approximately 138 square miles. The city is in the approximate center of the State of Florida and the four-county (Orange, Osceola, Seminole, Lake) Orlando-Kissimmee-Sanford Metropolitan Statistical Area (MSA), which has an estimated population of 2.9 million. The city operates under a Charter adopted February 4, 1885, as amended. The city has a seven-member City Council comprised of the Mayor (elected at large) and six District Commissioners. The city provides the full range of governmental services, including police and fire protection; street construction and maintenance; solid waste management; sewer services; parks, recreation and cultural services; planning and development services; a variety of transportation and public infrastructure programs; and other traditional support activities. Included in the city’s basic financial statements is the legally separate Downtown Development Board (DDB), which is reported separately (i.e., discretely presented). Although legally separate, because of the closeness of their relationship to the city, the Community Redevelopment Agency (CRA) and Downtown South Neighborhood Improvement District are reported as though they are part of the city (i.e., blended presentation).
What is an annual report to citizens?
This Annual Report to Citizens is Orlando’s version of a Popular Annual Financial Report (PAFR). The Government Finance Officers Association (GFOA) recommends governments produce a PAFR to provide a summarized overview of the city’s financial position in a simplified format for the benefit of citizens and other interested parties. The information presented is extracted from the City’s award-winning Annual Comprehensive Financial Report, which is a complete set of audited financial statements presented in accordance with accounting principles generally accepted in the United States of America, (GAAP). The Annual Report to Citizens is unaudited and not presented in GAAP format. This is not intended to replace the Annual Comprehensive Financial Report. For those interested in more detail, the City of Orlando’s Annual Comprehensive Financial Report and other financial documents are available at orlando.gov/financialdocuments. The PAFR is available to be viewed and downloaded at orlando.gov/pafr.
Achievements
The City of Orlando continues to be recognized for its financial reporting efforts. The GFOA has given an Award for Outstanding Achievement in Popular Annual Financial Reporting to the City of Orlando for its Annual Report to Citizens for the fiscal year ended September 30, 2023. The Award for Outstanding Achievement in Popular Annual Financial Reporting is a prestigious national award recognizing conformance with the highest standards for preparation of state and local government popular reports.
In order to receive an Award for Outstanding Achievement in Popular Annual Financial Reporting, a government unit must publish a Popular Annual Financial Report, whose contents conform to program standards of creativity, presentation, understandability, and reader appeal.
An Award for Outstanding Achievement in Popular Annual Financial Reporting is valid for a period of one year only. The City of Orlando has received a Popular Award for the last six consecutive years (fiscal years ended September 30, 2018, 2019, 2020, 2021, 2022, and 2023). We believe our current report continues to conform to the Popular Annual Financial Reporting requirements, and we are submitting it to the GFOA to determine its eligibility for another award.
The City of Orlando was also awarded the Certificate of Achievement for Excellence in Financial Reporting for its Annual Comprehensive Financial Report for the fiscal year ended September 30, 2023. This is the 46th consecutive year it has received the distinguished award.
On behalf of the Orlando City Council and staff, it is my pleasure to present to you the City of Orlando’s Annual Report to Citizens (Report) for the fiscal year ended September 30, 2024.
Accountability and responsible stewardship are key components of the financial reporting process. This Report will provide you with a snapshot of the city’s financial activities and achievements from the past year and is an illustration of our continued commitment to financial transparency.
We know that a strong partnership with you, our residents, is the best way to work through challenges and realize opportunity. With that in mind, as you review this report, please share any recommendations, concerns or questions you may have with our Office of Business and Financial Services at orlando.gov/obfs.
Sincerely,
Buddy Dyer
Mayor, City of Orlando
Property Tax Revenue
Ad valorem property taxes are the city’s largest source of revenue. The table below shows the total amount of tax collected in the last 5 years. Although the city’s millage rate (dollars of tax per $1,000 of taxable value) has remained the same, assessed property values have increased, resulting in more property tax revenue being collected.
City of Orlando Millage Rates Last Five Years
| Fiscal Year ended September 30 | Total Property Tax Revenue Collected | City of Orlando Millage Rate |
| 2020 | $217,565,362 | 6.6500 |
| 2021 | $238,347,498 | 6.6500 |
| 2022 | $249,498,430 | 6.6500 |
| 2023 | $284,198,792 | 6.6500 |
| 2024 | $319,288,993 | 6.6500 |

|
|
Ad Valorem Property Taxes
|
|
Non-ad Valorem Revenues
|
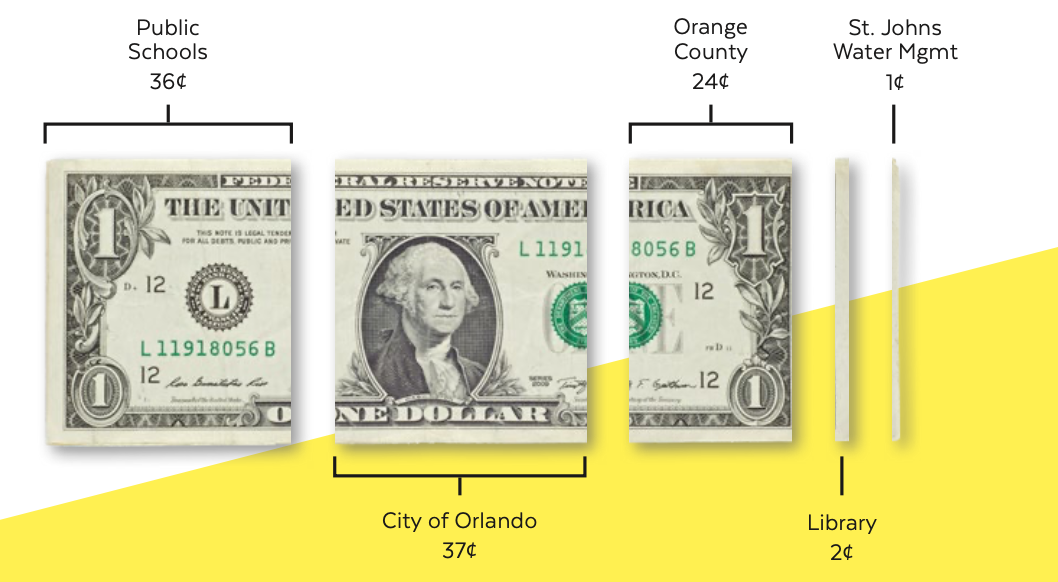
Where do Property Taxes Go?
The example below shows the total amount of property tax a resident would pay on a home with an assessed value of $380,000, and where those tax dollars go.
| House Assessed Value |
Exemption | Taxable Value |
Taxing Entity |
Millage Rate |
Tax Percentage | Taxes |
| $380,000.00 | $25,000.00 | $355,000.00 | Public Schools | 6.4210 | 36.00% | $2,279.46 |
| 380,000.00 | 50,000.00 | 330,000.00 | City of Orlando | 6.6500 | 37.00% | 2,194.50 |
| 380,000.00 | 50,000.00 | 330,000.00 | Orange County | 4.4347 | 24.00% | 1,463.45 |
| 380,000.00 | 50,000.00 | 330,000.00 | Library | 0.3748 | 2.00% | 123.68 |
| 380,000.00 | 50,000.00 | 330,000.00 | St. Johns Water Mgmt. | 0.1793 | 1.00% | 59.17 |
| Total: | 18.0598 | 100% | $6, 120.26 |
What is it and Why Do We Have One?
The city provides needed and desired government services to the public. In order to provide these services, the city must invest in the community by acquiring and constructing capital assets, such as buildings, infrastructure, roads, and parks. The capital improvement program is a road map, approved by City Council, which details and establishes the city’s capital investment priorities and policies over the next five fiscal years. The capital improvement program is of major significance to the city. The benefits derived from the projects intersect with and impact the lives of the city’s residents, businesses, and visitors through the provision of health, safety, transportation, recreation, cultural, and other services.
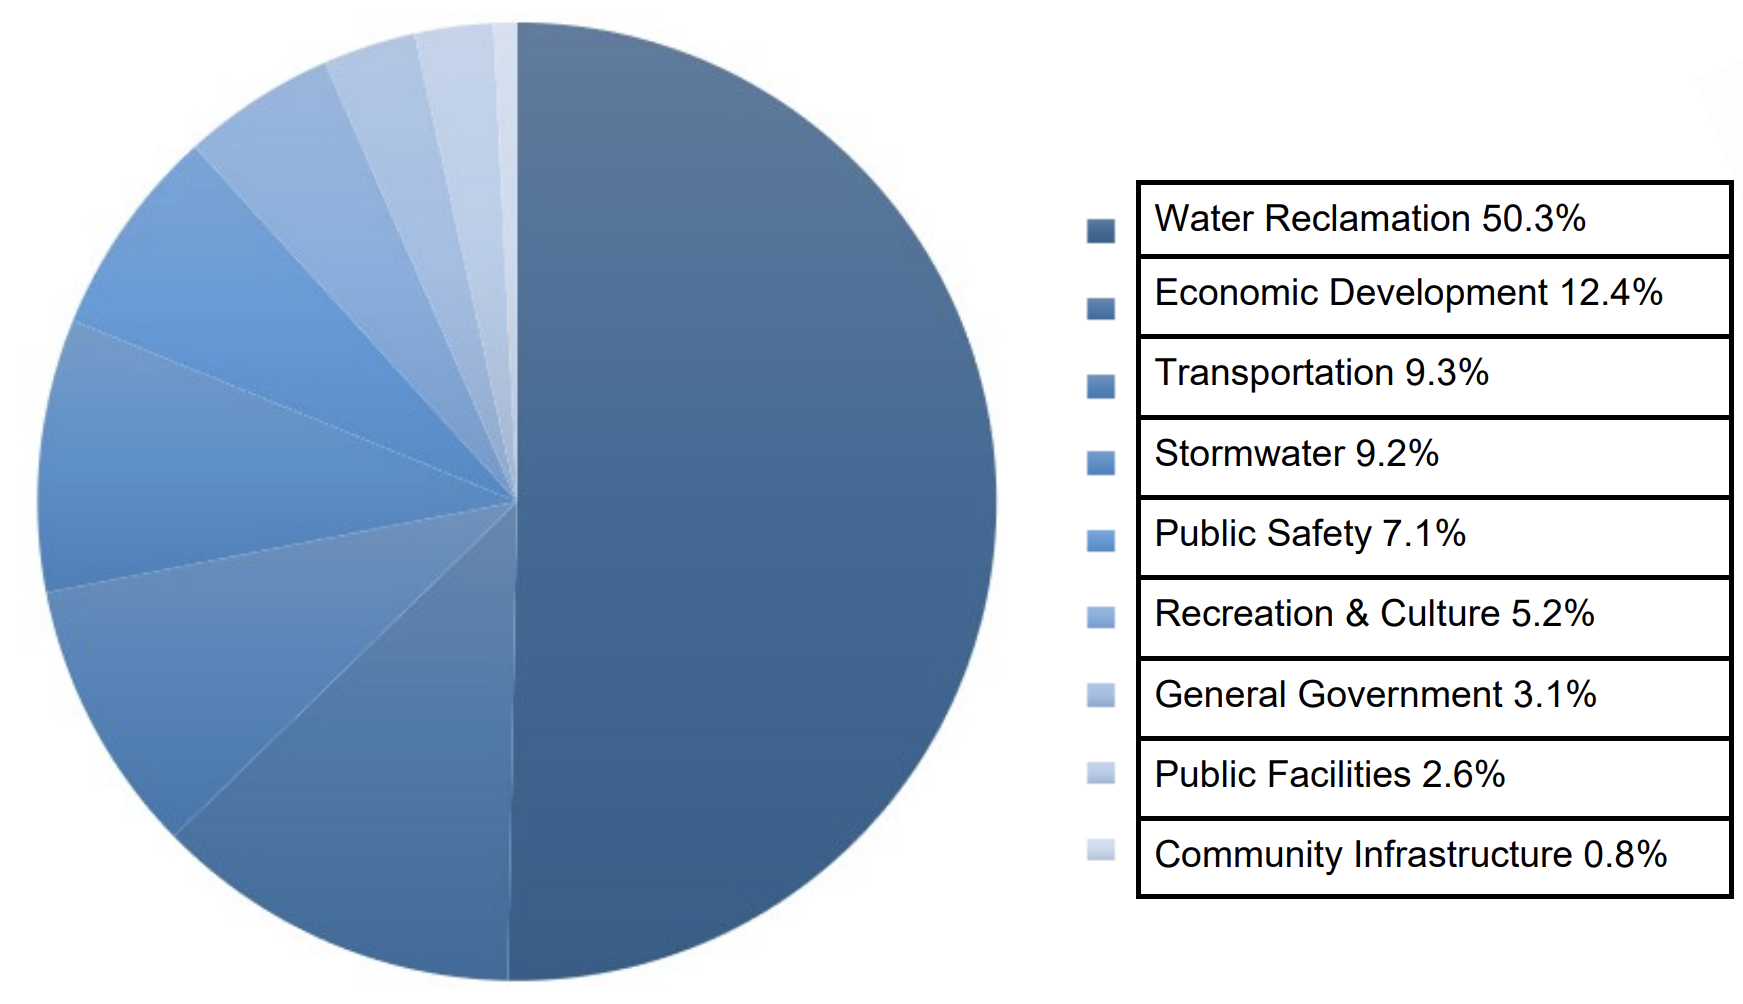
The following chart illustrates the FY2023/2024 Capital Budget by type of service.
| Type of Service | Capital Improvement Budget 2024 | % of Total |
| Water Reclamation | $128,759,000 | 50.3% |
| Economic Development | 31,707,237 | 12.4% |
| Transportation | 23,712,000 | 9.3% |
| Stormwater | 23,580,000 | 9.2% |
| Public Safety | 18,178,000 | 7.1% |
| Recreation and Culture | 13,246,000 | 5.2% |
| General Government | 7,990,000 | 3.1% |
| Public Facilities | 6,763,000 | 2.6% |
| Community Infrastructure | 2,020,710 | 0.8% |
| Total | $255,955,947 | 100% |
Capital Assets
Long-term investments in land, buildings, equipment, infrastructure or improvements.
Capital Budget
Funds budgeted to purchase or construct buildings, equipment, infrastructure or improvements.
The city’s statement of net position is a snapshot of its financial position. It presents all of the city’s assets and deferred outflows and liabilities and deferred inflows. The difference between assets and deferred outflows and liabilities and deferred inflows is known as net position. The change in net position from year to year serves as an indicator of the results of the city’s operations and financial position. For the fiscal year ended September 30, 2024, the city’s net position is $2,741,851,723. This is an increase of $204,357,299 over Fiscal Year 2023. Revenues and expenses are presented in the statement of activities. See glossary for definitions of key terms.
Condensed Statement of Net Position
| FY2020 | FY2021 | FY2022 | FY2023 | FY2024 | Change 2024 vs 2023 |
|
| Current and Other Assets |
$1,555,883,472 | $1,594,916,173 | $1,404,198,143 | $1,527,137,619 |
$1,663,758,210
|
$136,620,591 |
| Capital Assets | 2,421,109,760 | 2,539,758,200 | 2,620,371,907 | 2,654,184,818 | 2,696,397,784 | 42,212,966 |
| Deferred Outflows of Resources |
181,684,522 | 187,533,378 | 161,752,559 | 368,867,817 | 275,706,768 | (93,161,049) |
| Total Assets and Deferred Outflows |
4,158,677,754 | 4,322,207,751 | 4,186,322,609 | 4,550,190,254 | 4,635,862,762 | 85,672,508 |
| Current Liabilities |
318,979,012
|
379,774,993 | 122,520,907 | 138,366,951 | 143,480,822 | 5,113,871 |
| Long-Term Liabilities |
1,715,596,648 | 1,695,083,248 | 1,445,717,130 | 1,733,010,775 | 1,636,226,427 | (96,784,348) |
| Deferred Inflows of Resources |
37,636,969 | 47,034,442 | 237,524,041 | 141,318,104 |
114,303,790
|
(27,014,314) |
| Total Liabilities and Deferred Inflows |
2,072,212,629 | 2,121,892,683 | 1,805,762,078 | 2,012,695,830 | 1,894,011,039 | (118,684,791) |
| Net Position | $2,086,465,125 | $2,200,315,068 | $2,380,560,531 | $2,537,494,424 | $2,741,851,723 | $204,357,299 |
Condensed Statement of Activities
| FY2020 | FY2021 | FY2022 | FY2023 | FY2024 | Change 2024 vs 2023 |
|
| Revenues | $1,079,325,407 | $1,011, 946,309 | $1,158,430,184 | $1,227,517,969 | $1,421,286,946 | $193,768,977 |
| Expenditures | 905,574,887 | 913,483,486 | 978,184,721 | 1,070,584,072 |
1,216,929,647
|
146,345,575 |
| Change in Net Position |
173,750,520 | 98,462,823 | 180,245,459 | 156,933,897 | 204,357,299 | 47,423,402 |
| Net Position – Beginning |
1,912,714,605 | 2,086,465,125 | 2,200,315,068 | 2,380,560,527 | 2,537,494,424 | 156,933,897 |
| Prior Period Adjustment |
– | 15,387,120 | – | – | – | – |
| Net Position – Ending |
$2,086,465,125 | $2,200,315,068 | $2,380,560,531 | $2,537,494,424 | $2,741,851,723 | $204,357,299 |
The city is required to account for its finances using fund accounting. Fund accounting separates revenues and expenses into different funds or “buckets”, based on the source of the revenue and its intended use. The largest “bucket” and chief operating fund of the city is the General Fund. Most of the city’s revenues and expenses are accounted for here. General Fund revenues include property tax, licenses, permitting fees, utility taxes, state taxes, contributions such as revenue sharing, and service charges. General Fund expenses include police, fire, parks and recreation, business and financial services, transportation, economic development, and public works services. The table below provides a summary and comparison of General Fund revenues, expenses, transfers, and net change in fund balance. The charts present expenditures by department and revenues by source for the General Fund for the Fiscal Year ended September 30, 2024. Total revenues increased $66,343,632 compared to the same period last year. Property Tax was the largest source of revenue for the General Fund representing 43% of the total. Total expenditures increased by $52.1 million compared to the same period last year. Public Safety (Police and Fire services) was the largest expense for the General Fund, representing approximately 57% of total expenses.
Total General Fund revenues increased $66.3 million, or 9.9% compared to fiscal year 2023. Property Taxes increased by $35.0 million due to an increase in the taxable value from prior year. Investment income increased by $13.0 million, primarily the result of the City’s rate of return increasing from 3.9% in fiscal year 2023, to 6.7% in fiscal year 2024. General Fund expenditures increased by $52.1 million or 9.2% over fiscal year 2023. Most of this increase is due to an increase in personnel costs across all General Fund departments. This was followed by an increase in other contractual services in the Family Parks and Recreation, Housing and Community Development, and Police Departments. The majority of the remaining increase was in repairs in maintenance in the Information Technology Division and a slight increase to repairs and maintenance of vehicles across several departments.
| 2022 | 2023 | 2024 | Change (2024 vs 2023) |
|
| Revenues | 587,466,413 | 671,029,019 | 737,372,651 | 66,343,632 |
| Expenditures | 462,281,029 | 565,546,306 | 617,634,222 | 52,087,916 |
| Net Transfers in (Out) to Other Funds | (59,798,915) | (92,247,441) | (82,436,942) | 9,810,499 |
| Issuance of Debt | – | 428,397 | – | (428,397) |
| Subscription-Based IT Arrangements | – | 13,616,873 | 4,989,244 | (8,627,629) |
| Lease Financing | 3,395,770 | – | 5,329,299 | 5,329,299 |
| Change in Fund Balance | 68,782,239 | 27,280,542 | 47,620,030 | 20,339,488 |
The City of Orlando primarily issues bonds to pay for large and long-lived capital assets such as parks, roads, water treatment plants, and buildings. Sometimes existing bonds are refunded with new bonds to achieve savings on interest costs.
There are multiple benefits to paying for large and long-lived capital assets with debt. One benefit is that future users of the assets will bear some of the cost through taxes or other charges that help pay the debt over time.
The city consistently achieves some of the highest bond ratings possible from the major ratings agencies Moody’s, Standard & Poor’s and Fitch. High bond ratings indicate that the city is financially strong, stable and able to repay its debt, which generally results in lower interest costs.
Governmental Activities
| Fund | Purpose | Payment Source | Issued | Outstanding |
| Community Redevelopment Agency |
Capital Projects and Dr. Phillips Center for the Performing Arts |
Tax Increment Revenues | $185,551,000 | $115,039,620 |
| Capital Improvement | Public Safety, Neighborhood Improvement and Capital Projects |
Non-ad Valorem Revenues | $272,488,666 | $213,978,564 |
| Total Government Debt |
$458,039,666 | $329,018,184 |
Business Type Activities
| Fund | Purpose | Payment Source | Issued | Outstanding |
| Parking | Parking Garage Construction |
Parking Revenues | $37,237,000 | $34,869,000 |
| Orlando Venues | Community Venues | State Sales Tax and Tourist Development Tax |
341,335,000 | 291,540,000 |
| Water Reclamation | Water Reclamation Projects |
Water Reclamation Revenues |
180,359,019 | 90,911,391 |
| Stormwater | Stormwater Projects |
Stormwater Utility Revenues
|
16,154,334 | 15,144,436 |
| Total Business Type Debt |
$575,085,353 | $432,464,827 | ||
| Total City Debt | $1,033,125,019 | $761,483,011 |
|
|
|
Governmental Activities
|
| Bond Rating
A measure of financial strength that provides the ability to obtain low interest rates.
|
| Business Type Activities
City services that charge users based on the cost of providing the service.
|
| Tourist Development Tax (TDT)
A tax on the amount paid by guests for short-term accommodation (less than six months). This 6% tax is collected by Orange County and Florida Statutes require the funds to be used for designated tourism-related expenditures. The county contributes TDT revenue to the City of Orlando to support debt service payments on the outstanding TDT revenue bonds.
|
| Government-wide
The city as a whole.
|
Demographics and Economic Statistics
(Last 10 Fiscal Years)
| Year | City Population | Orlando-Kissimmee-Sanford MSA Population | City Personal Income (in thousands) | Per Capita Personal Income | Unemployment Rate | ||
| 2015 | 262,949 | 2,320,195 | 10,158,246 | 38,632 | 4.9% | ||
| 2016 | 271,752 | 2,376,358 | 10,916,006 | 40,169 | 4.4% | ||
| 2017 | 279,789 | 2,437,975 | 11,605,648 | 41,480 | 3.2% | ||
| 2018 | 285,099 | 2,508,570 | 12,399,241 | 43,491 | 2.7% | ||
| 2019 | 291,800 | 2,585,614 | 13,176,521 | 45,156 | 2.8% | ||
| 2020 | 298,943 | 2,645,784 | 14,415,928 | 48,223 | 9.8% | ||
| 2021 | 314,506 | 2,741,997 | 16,700,989 | 53,102 | 4.4% | ||
| 2022 | 321,904 | 2,794,178 | 17,369,618 | 53,959 | 2.7% | ||
| 2023 | 326,988 | 2,833,764 | 18,891,405 | 57,774 | 3.1% | ||
| 2024 | 335,066 | 2,889,412 | N/A | N/A | 3.4% | ||
Principal Employers
| Employer | Type of Business | Number of Employees |
2024 Rank | Percentage of Total MSA Employment |
| Walt Disney World | Leisure and Hospitality | 75,000 | 1 | 5.25 |
| Advent Health | Healthcare | 35,938 | 2 | 2.52 |
| Universal Orlando Resort | Leisure and Hospitality | 28,000 | 3 | 1.96 |
| Orlando Health | Healthcare | 26,397 | 4 | 1.85 |
| Orange County Public Schools | Education | 24,685 | 5 | 1.73 |
| Walmart | Service (Grocery) | 16,475 | 6 | 1.15 |
| Seminole County Public Schools | Education | 14,813 | 7 | 1.04 |
| Lockheed Martin Corp. | Aerospace/Defense | 14,547 | 8 | 1.0 |
| University of Central Florida | Education | 13,078 | 9 | 0.92 |
| Orange County Government | Government | 8,000 | 10 | 0.56 |
| Other Employers | Various | 1,170,737 | 82.00 | |
| Total | 1,427,670 | 100.00 |
Source: Orlando Business Journal and Metro Orlando Economic Development Commission.
Note: Includes the four counties in the Orlando-Kissimmee-Sanford Metropolitan Statistical Area (MSA), Orange, Seminole, Osceola and Lake.
Current and Other Assets
Assets such as cash, investments, receivables and inventory that can be converted to cash within one year.
Current Liabilities
Debts that can be paid off in one year or less, such as accounts payable and accrued payroll.
Deferred Inflows of Resources
An acquisition of net position by the government that is applicable to a future reporting period.
Deferred Outflows of Resources
A consumption of net position by the government that is applicable to a future reporting period.
Expenses/Expenditures
Money spent or costs incurred through the city’s operations.
Fund
A self-balancing set of accounts which are segregated for specific activities or objectives. Funds are often referred to as “buckets.”
Fund Balance
The difference between assets and deferred outflow of resources and liabilities and deferred inflow of resources of a fund.
General Fund
The chief operating fund of the city.
Government Finance Officers Association (GFOA)
Organization which represents public finance officials and promotes excellence in public finance by providing best practice guidance, recognition programs, research and training.
Long-Term Liabilities
Represents mainly debt obligations of the city.
Millage Rate
Dollars of tax per $1,000 of taxable value.
Net Position
The difference between assets and deferred outflow of resources and liabilities and deferred inflow of resources for the city as a whole.
Prior Period Adjustments
The correction of an error or retroactive application of a new accounting rule.
Revenues
Income from taxes and charges to individuals who purchase, use, or benefit from goods or services.
Subscription-Based Information Technology Arrangement (SBITA)
A contract that conveys control of the right to use another party’s information technology software as specified in a contract, for a period of time. A new governmental accounting standard in effect for fiscal year 2023 requires these to be recorded as an asset and a liability rather than as an expenditure of the period as in prior years.