

Strong corporate profits and high bond yields make it a compelling time to invest in individual corporate bonds. Corporate bond yields can be heavily impacted by US Treasury yields, and the recent rise in certain US Treasury yields to near-20-year highs has created many new bond-buying opportunities. Higher bond yields not only mean higher income today, but they can also drive capital appreciation should yields fall in the future.
As we discuss in this fixed income blog post, as US Treasury yields have risen since the onset of the Iran War, many corporate bonds offer materially higher yields and capital appreciation opportunities than they did several months ago.
How US Treasury Yields Impact Corporate Bond Yields and Prices
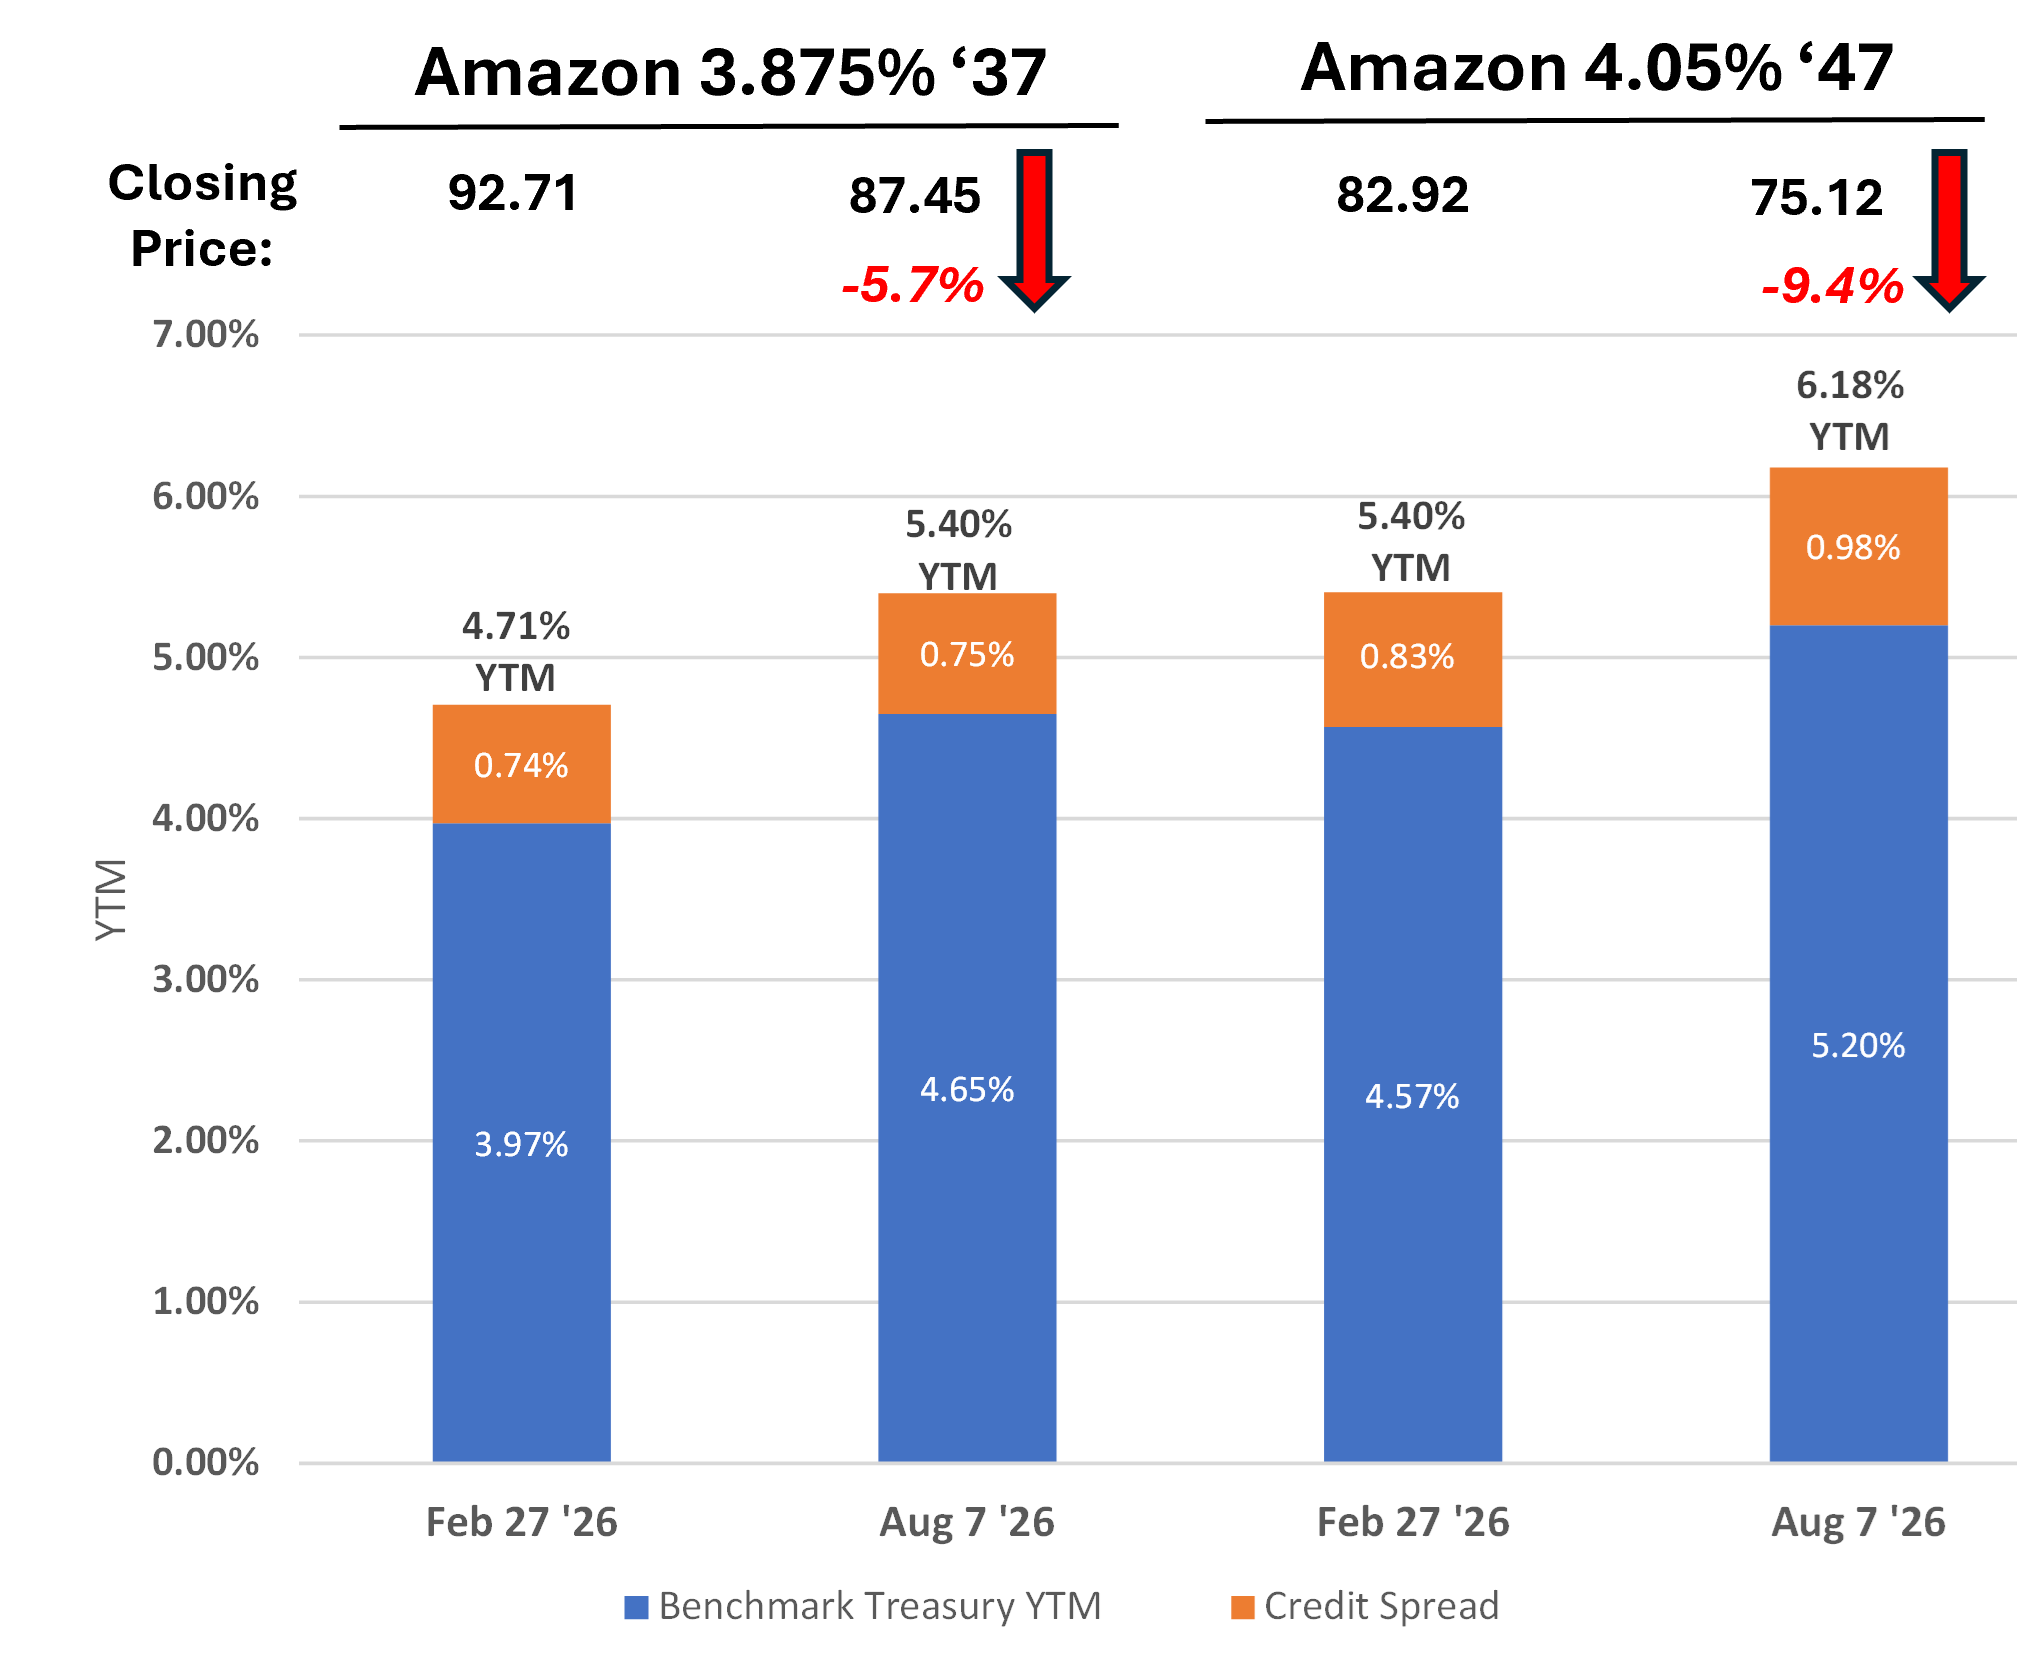
Figure 1 shows the impact of recent rising US Treasury yields, and how it has driven the yields of Amazon bonds higher. In the Figure 1 example, the Amazon 4.05% ’47 bond price has fallen 9.4% to 75.12, as the bond’s YTM has increased 78 basis points (or 0.78 percentage points) from February 27 to August 7. The Amazon ’37 bond’s YTM has increased 69 basis points since February 27; however, due to its shorter-dated 2037 maturity, the bond has fallen 5.7%, much less than the Amazon ’47 bond.
Figure 1. Drivers of Amazon ’37 and Amazon ’47 Bond Price Changes: February 27 to August 7, 2026
Sources: US Treasury, FINRA TRACE, and Fidelity.com data charted by Bondsavvy.
What Drove the Amazon Bonds’ Yields Higher and Prices Lower
Individual corporate bond yields include two components: 1) the YTM of the “benchmark US Treasury” (the blue bar in Figure 1) and 2) the credit spread (the orange bar in Figure 1). The benchmark US Treasury is the US Treasury note or bond that has a maturity date near that of the corporate bond. In Figure 1, for the Amazon 3.875% 8/22/37 bond (“Amazon ’37”; CUSIP 023135BF2), we are using the 10-year US Treasury as its benchmark Treasury. We use the 20-year US Treasury as the benchmark US Treasury for the Amazon 4.05% ’47 bond (“Amazon ’47”; CUSIP 023135BJ4).
The credit spread is the difference between a corporate bond’s YTM and that of the benchmark US Treasury. It represents the additional yield a corporate bondholder is receiving for taking on a corporate bond issuer’s default risk.
For both the Amazon ’37 and Amazon ’47 bonds, the bigger driver in the bonds’ YTM changes since February 27 was increases in the benchmark US Treasury yields. For Amazon ’37, the 68-basis-point increase in the 10-year US Treasury yield accounted for all but one basis point of the bond’s YTM increase.
For Amazon ’47, the 78-basis-point increase in the bond’s yield was driven by a 63-basis-point increase in the 20-year US Treasury yield and a 15-basis-point increase in the credit spread. Amazon has been increasing its debt load significantly to fund its AI-related ambitions, which has driven a higher credit spread for the ’47 bond.
Recent Trends for 2-Year, 10-Year, and 20-Year US Treasury Yields
Understanding how current US Treasury yields compare to historical yields enables investors to assess the bond market’s “value.” Higher yields mean more bang for your investing buck and higher potential capital appreciation, especially for longer-date bonds.
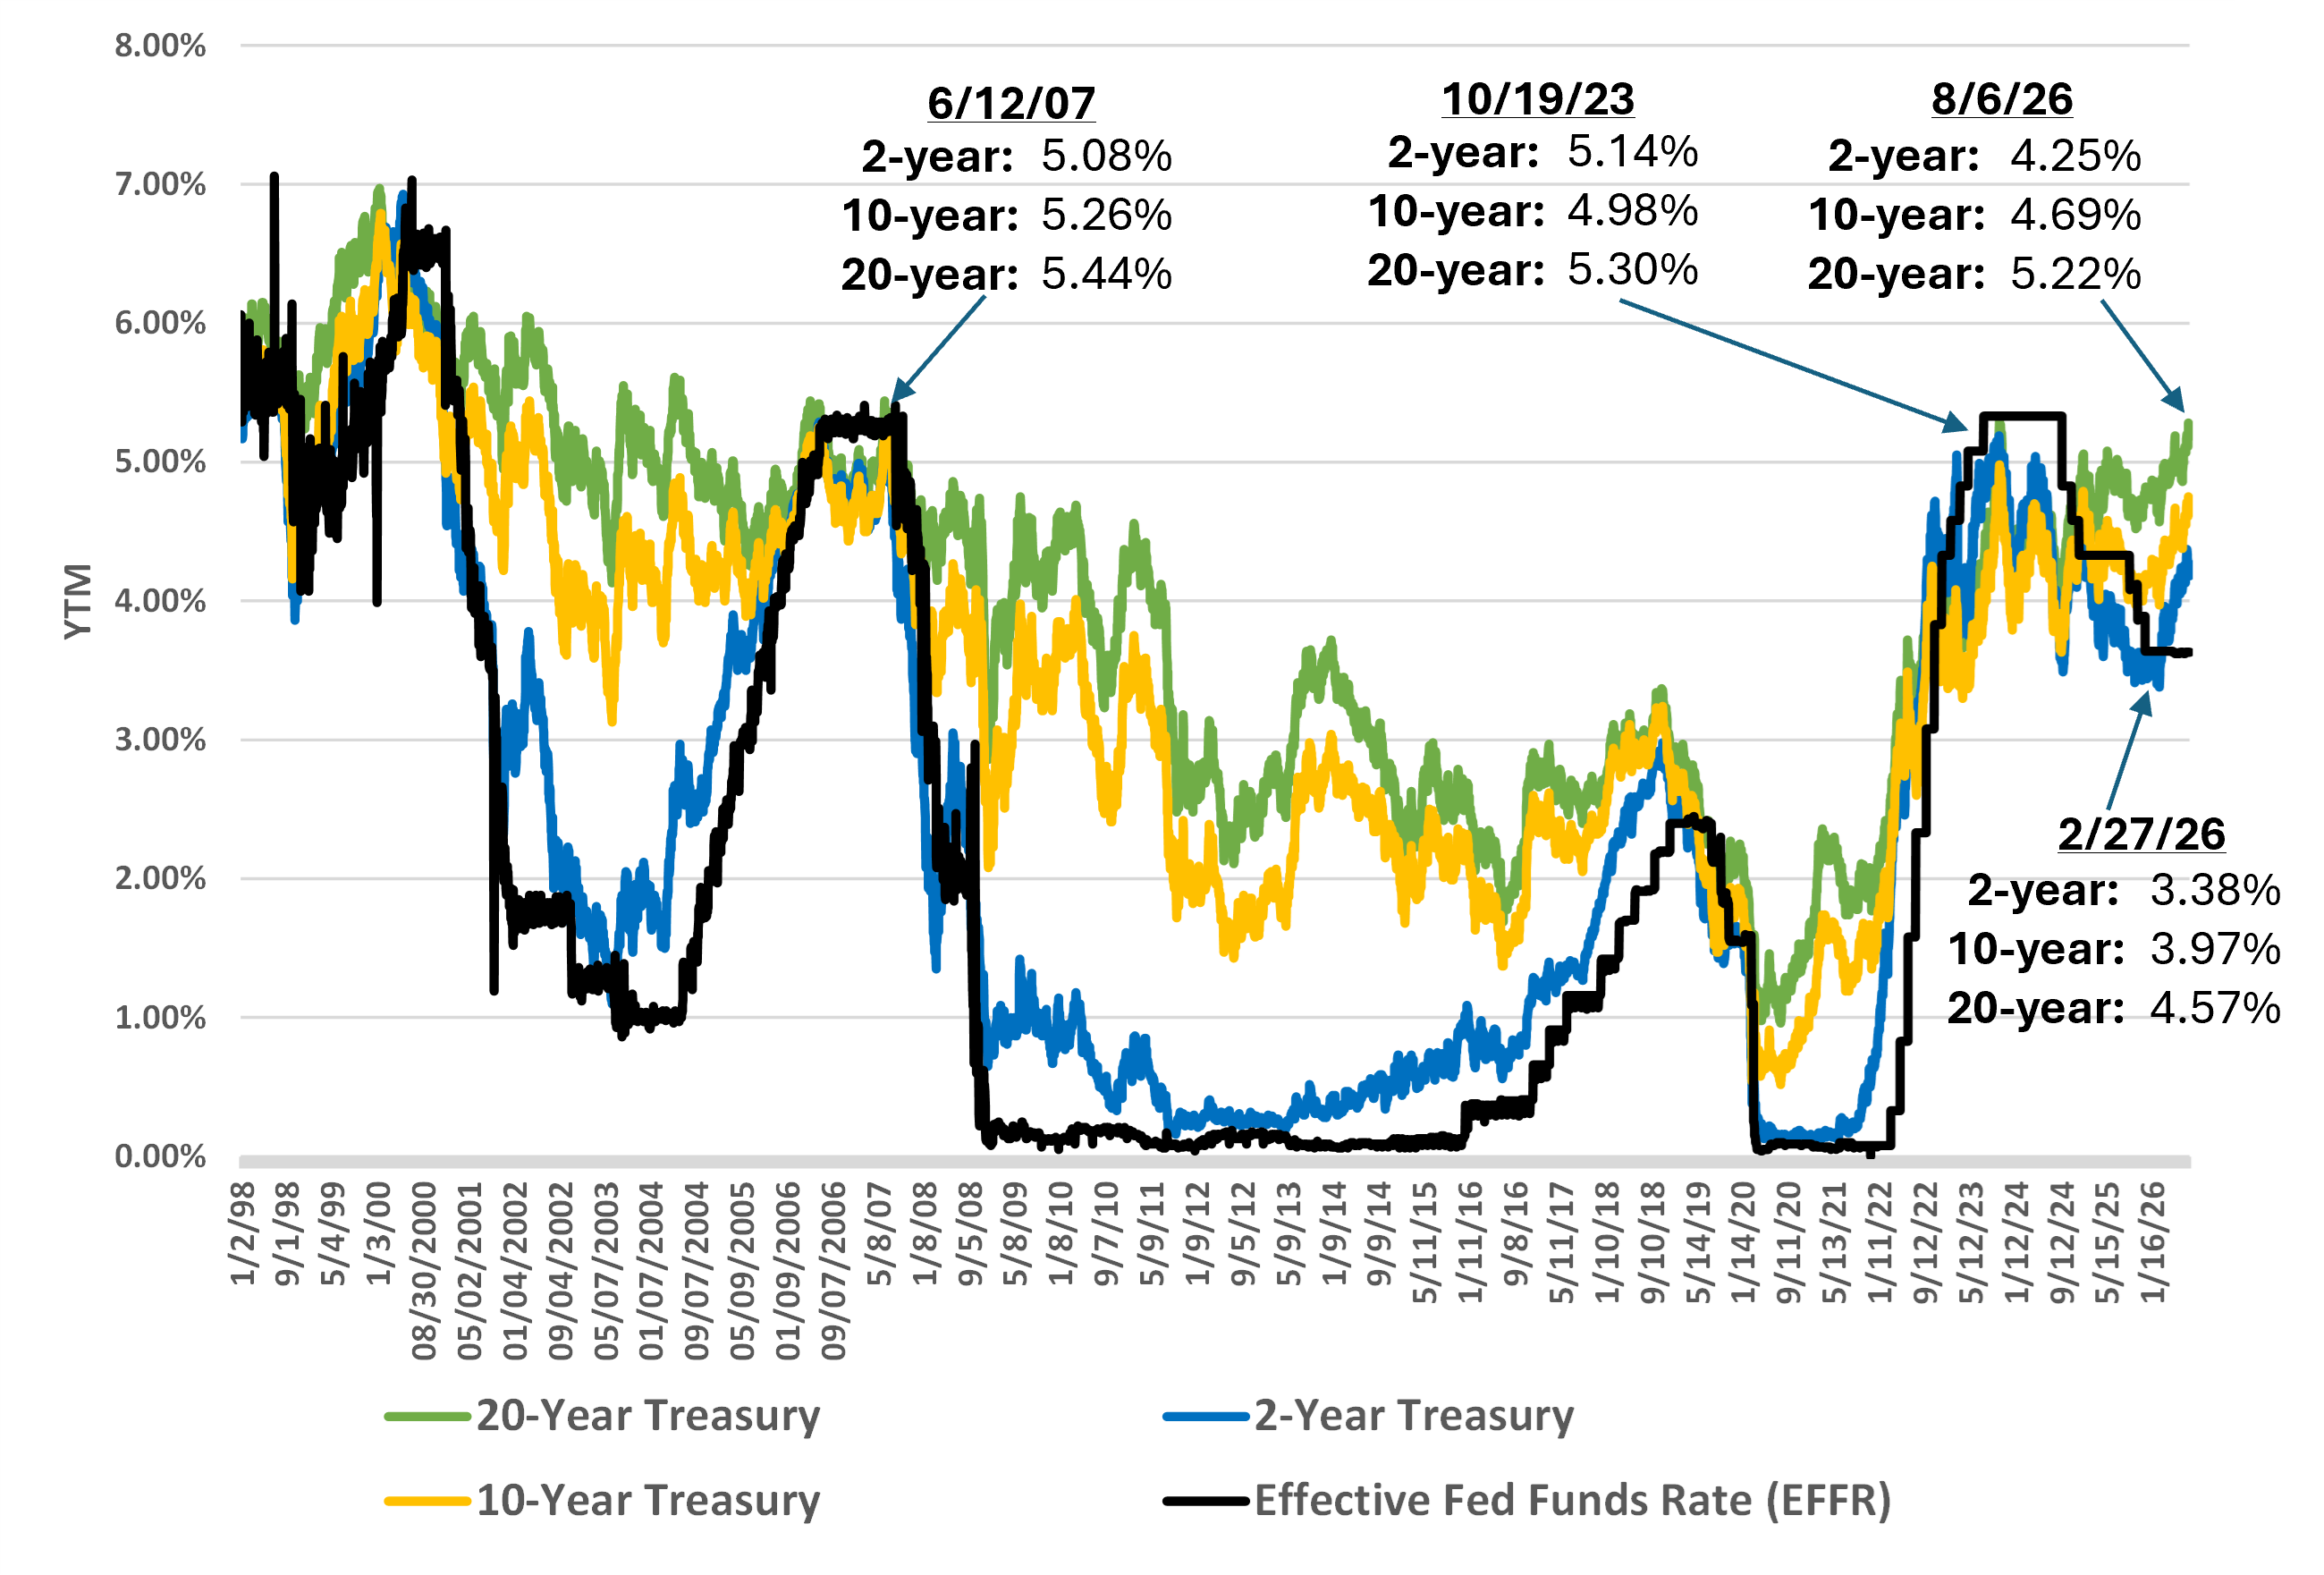
Figure 2 shows historical US Treasury yields compared to the effective fed funds rate. Key takeaways include:
- Nearing 20-Year High Yields: On August 6, 2026, the 20-year US Treasury yield of 5.22% was nearing the highest levels reached over the last 20 years.
- Iran War Impact: From February 27, the 10-year US Treasury yield has increased 72 basis points to 4.69%, nearing recent highs last seen in October 2023.
- Mitigated Impact of Rate Cuts: The Fed has lowered the federal funds rate by 175 basis points from when yields peaked in October 2023. While the 2-year US Treasury yield has fallen 89 basis points to 4.25% since October 2023, 10- and 20-year US Treasury yields are nearing October 2023 levels.
Figure 2. Historical US Treasury Yields vs. the Effective Fed Funds Rate: January 2, 1998-August 6, 2026
Source: US Treasury and US Federal Reserve data charted by Bondsavvy.
Comparing Today’s US Treasury Yield Curve
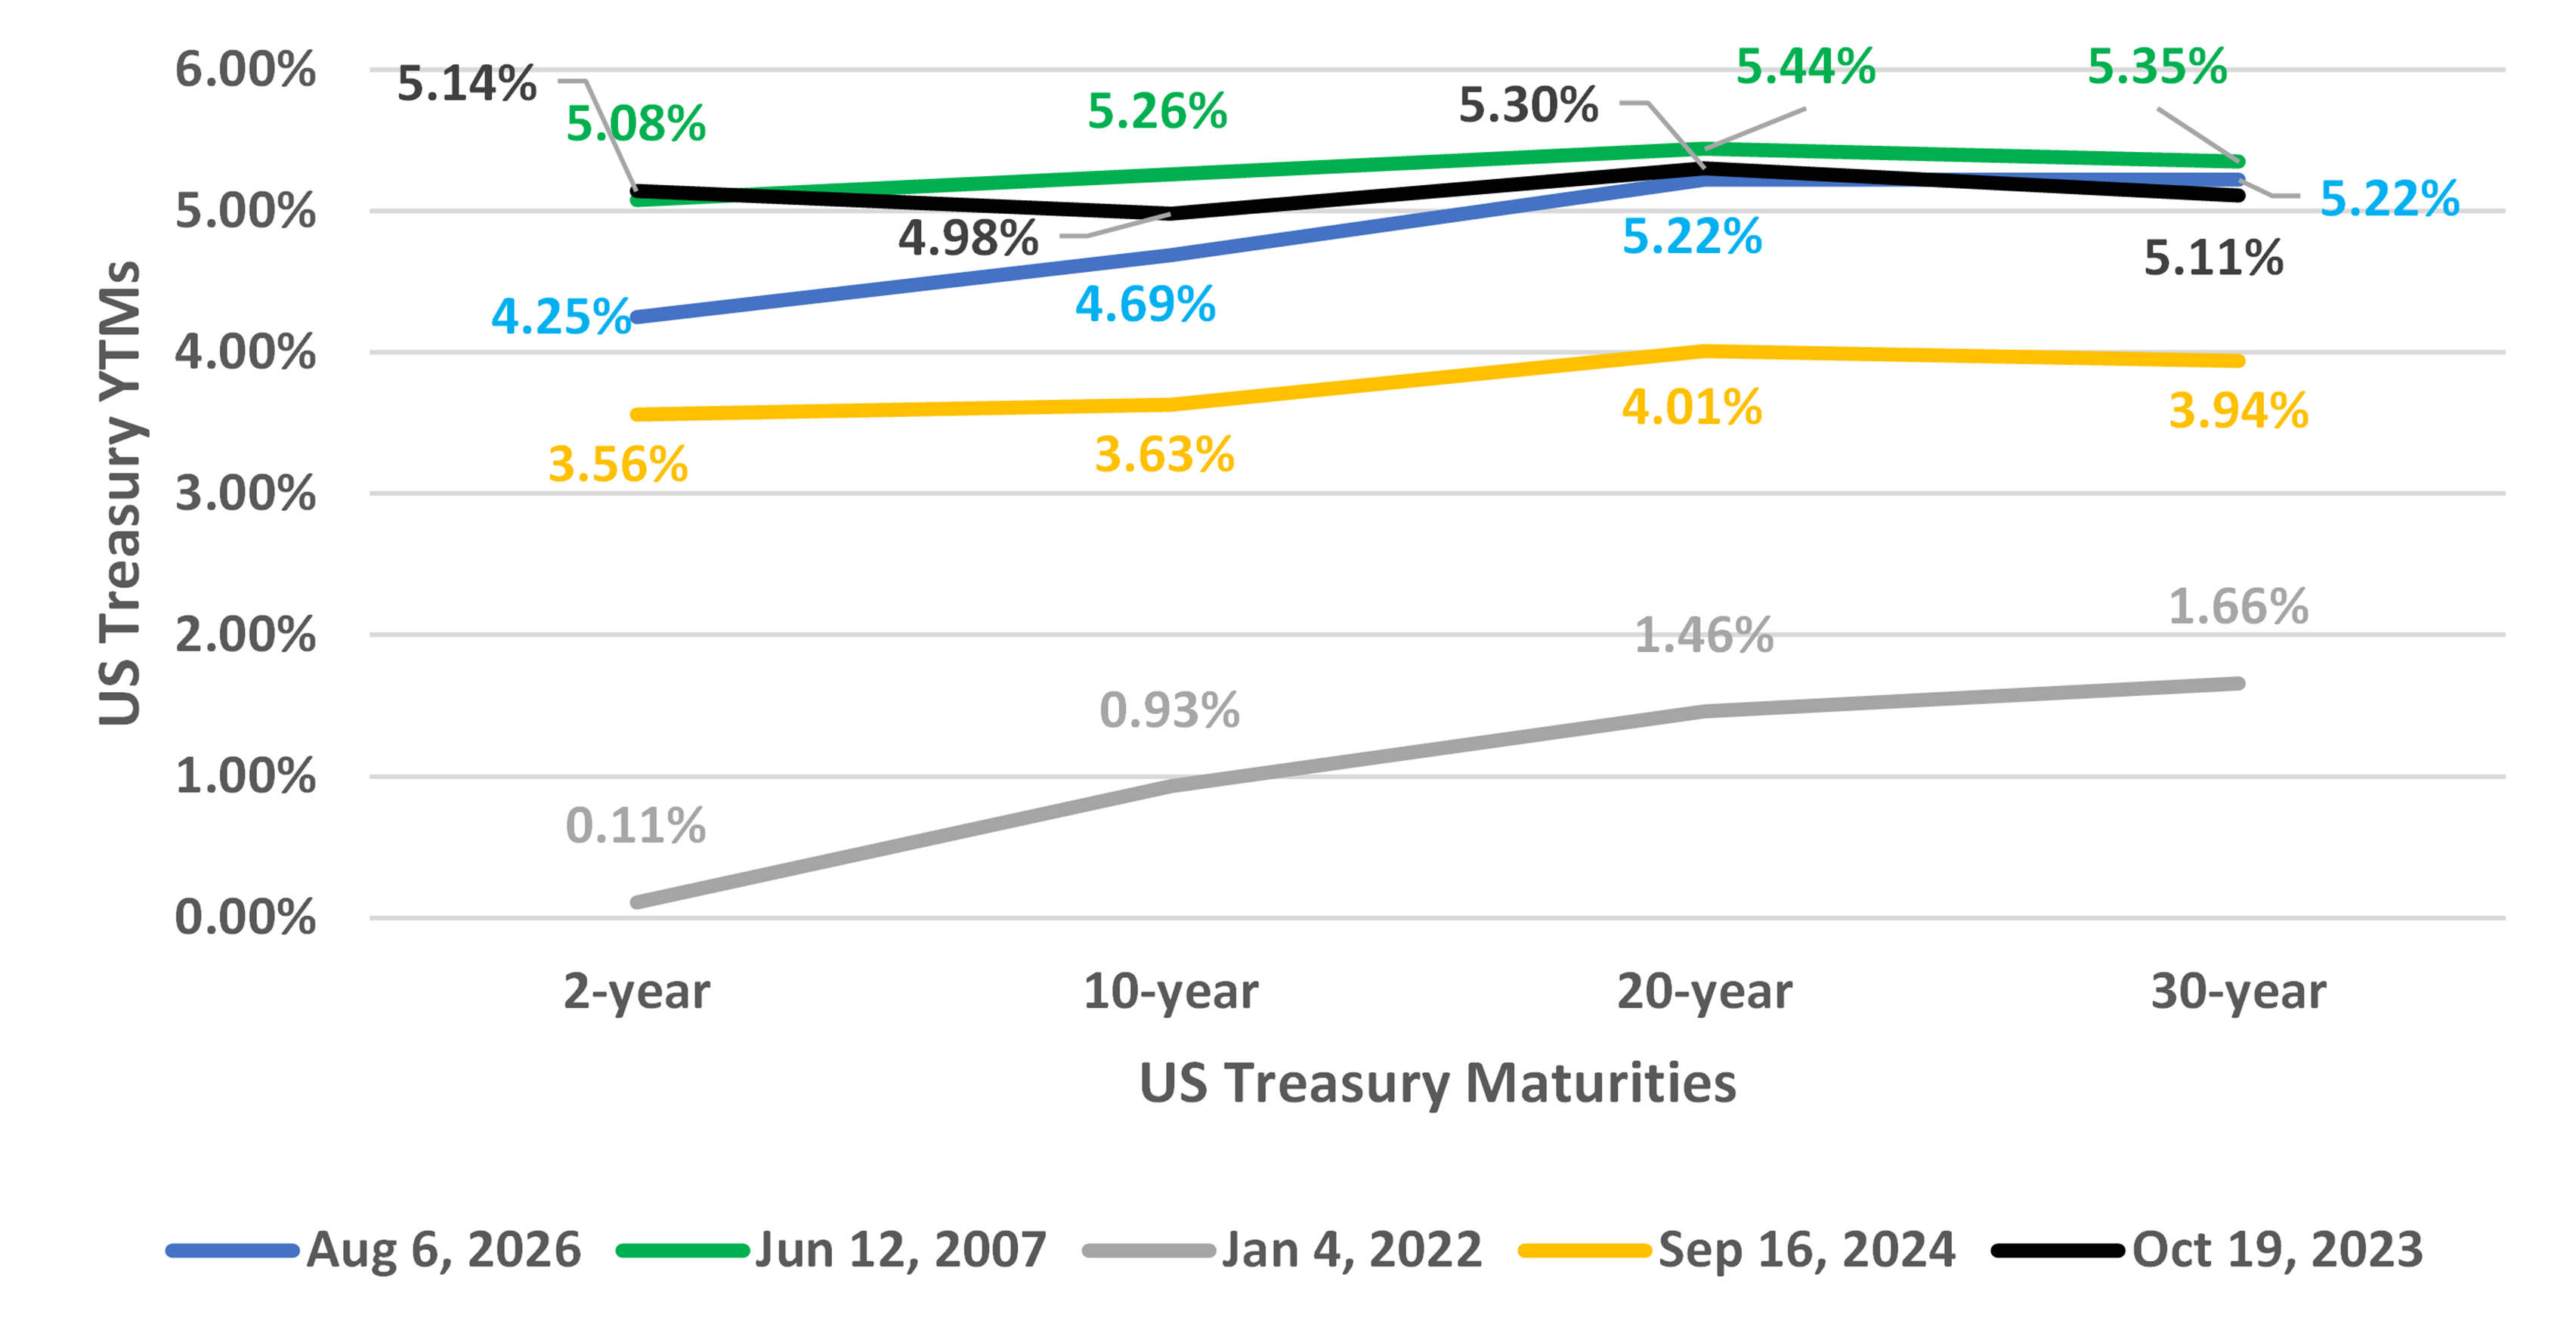
A somewhat cleaner way to look at historical US Treasury yields is to compare US Treasury yield curves at different points in time, as we have done in Figure 3. A US Treasury yield curve is a snapshot in time and shows investors Treasury yields of bonds maturing in different years.
Analyzing US Treasury yield curves enables investors to:
- Determine, at a given time, how longer- and shorter-term yields compare, which can enable investors to narrow their focus on certain maturity-date ranges
- Evaluate how today’s 2-year, 10-year, 20-year, and 30-year US Treasury yields compare to historical yield curves
Figure 3. Select US Treasury Yield Curves: June 12, 2007 to August 6, 2026
Source: US Treasury data charted by Bondsavvy.
Key takeaways from the historical US Treasury yield curves shown in Figure 3 include:
- On August 6, 20- and 30-year US Treasury yields were near 20-year highs, reflecting compelling value in the “long end” of the yield curve.
- The 4.69% 10-year US Treasury yield on August 6 was still below recent highs but more than one point higher than the recent September 16, 2024 yield trough.
- Compelling bond investment opportunities in January 2022, when bond yields were extremely low, were few and far between.
Of course, for corporate bonds, US Treasury yields are only part of the story. They enable bond investors to obtain a general sense of where there’s value in the bond market, especially across maturity dates. The next step in Bondsavvy’s corporate bond analysis is to compare credit spreads to issuing-company financials to further pinpoint corporate bonds we believe can outperform bond funds and ETFs.
Why Own Corporate Bonds vs. US Treasurys
Individual corporate bonds have several important advantages over US Treasurys, including:
- Higher yields: As shown in Figure 1, on August 7, owning the Amazon ’37 and Amazon ’47 offered YTMs 75 and 98 basis points higher than the benchmark US Treasury bonds.
- Greater capital appreciation opportunities: Capital appreciation opportunities for US Treasurys are tied solely to decreases in US Treasury yields. Corporate bonds, on the other hand, have two avenues for capital appreciation: lower US Treasury yields and lower credit spreads.
- Lower interest rate risk: Corporate bond yields have a credit spread component, which can mollify the impact of rising US Treasury yields. If a benchmark US Treasury yield increases 25 basis points and a corporate bond’s credit spread falls 25 basis points, the corporate bond’s yield will be unchanged. Of course, corporate bonds with low credit spreads can still have significant interest rate risk depending on a bond’s time to maturity.
- Comparable credit quality in many cases: Historical investment-grade corporate bond default rates have generally been below 0.2%. While corporate bond issuers cannot print money and lack taxing authority, many are extremely profitable, have limited debt relative to their earnings, and do not carry the massive obligations (such as national defense and entitlements) of the US government.
- Ability to build a more-customized portfolio: US Treasury bond investors have one diversification tool at their disposal: bond maturity dates. On the other hand, corporate bond investors can choose from 11,000 individual corporate bonds available when investing in bonds online. There, they can construct portfolios across many different industries, yield levels, and maturity dates to fit their investment objectives and risk tolerance.
Why Buy Corporate Bonds When US Treasury Yields Are High
The most successful corporate bond investments are those that have high yields relative to an issuer’s financials and achieve capital appreciation. Achieving both of these objectives is more possible when US Treasury yields are high.
Case Study of Buying During Recent High Yields: Encompass Health ’31
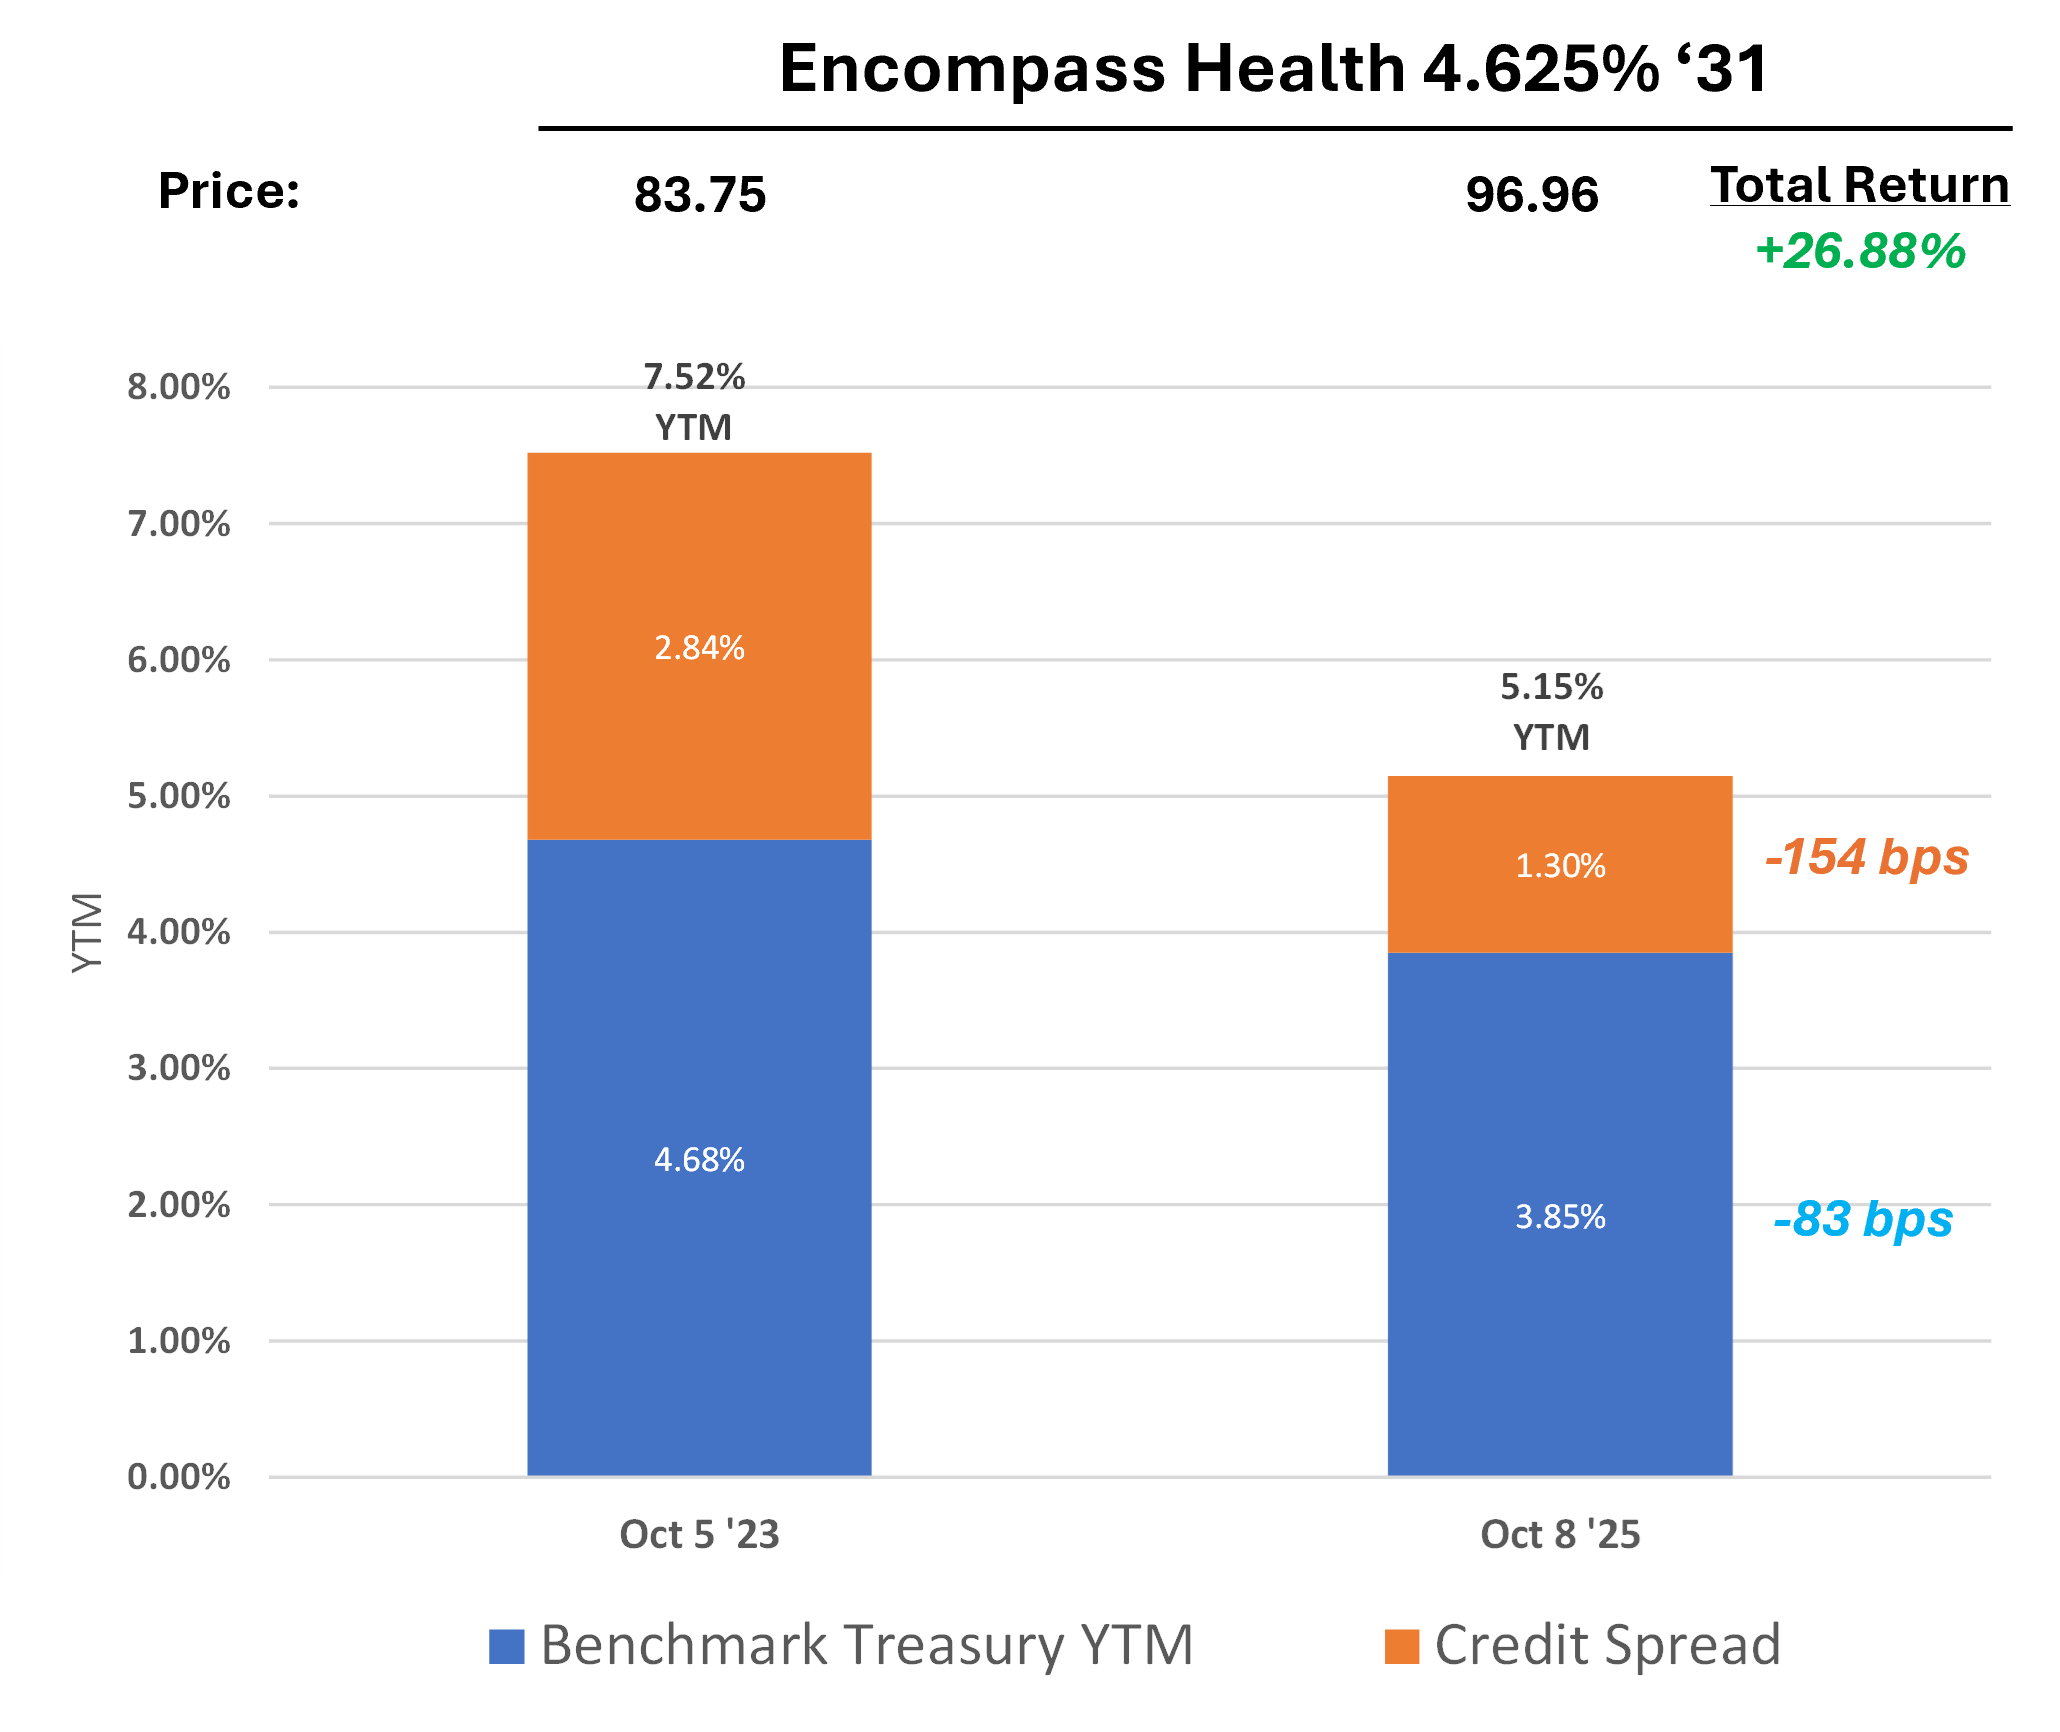
Bondsavvy made a set of corporate bond investment recommendations on October 5, 2023, shortly before the 20-year US Treasury yield peaked on October 19, 2023 at 5.30%. One of these recommendations was Encompass Health 4.625% ’31 (CUSIP 29261AAE0), which we recommended at a price of 83.75 and a YTM of 7.52%. Encompass Health is the largest owner-operator of inpatient rehabilitation facilities in the United States.
As shown in Figure 4, over the next two years, the benchmark US Treasury fell 83 basis points and the bond’s credit spread fell 154 basis points. These drove the bond’s YTM down by 237 basis points, resulting in a 13.2-point increase in the Encompass bond’s price. The bond’s high yield and capital appreciation generated a +26.88% total return over the two-year period.
Figure 4. Encompass Health ’31 Case Study: Drivers of Bond Price Performance October 5, 2023-October 8, 2025
Source: US Treasury, FINRA, and Fidelity.com data graphed by Bondsavvy.
You can view the performance of all previous Bondsavvy investment recommendations by viewing our investment performance page.
This Encompass Health case study illustrates a key advantage of owning individual corporate bonds over US Treasurys. For corporate bonds, there can be two drivers of capital appreciation: 1) falling US Treasury yields and 2) a bond’s falling credit spread. US Treasurys can only achieve capital appreciation from falling US Treasury yields. The higher income and greater capital appreciation opportunities offered by individual corporate bonds make them a compelling alternative to owning US Treasurys.
It’s a fair argument that a bond issued by BB-rated Encompass Health is not directly comparable to a US Treasury note or bond. That said, the same concepts of higher yields and greater capital appreciation opportunities hold true for many investment grade bonds, some of which have credit quality on par with the US government.
Choose My Plan
Watch Free Sample