


Tesla stock (NASDAQ: TSLA) has entered a sharp correction after failing to breakout above the Golden Ratio resistance. The recent sell-off has pushed the stock toward a critical long-term support cluster, where multiple technical factors are beginning to converge. While short-term momentum remains decisively bearish, Tesla is now testing an area that could determine whether the broader bull market remains intact or whether a deeper correction toward the next Fibonacci supports unfolds.
Despite the recent weakness, the long-term trend has not yet been invalidated. Investors are now closely watching whether Tesla can establish a meaningful bottom around current levels before attempting another move toward its all-time high at $498.83.
Tesla Stock Approaches Critical Long-Term Support
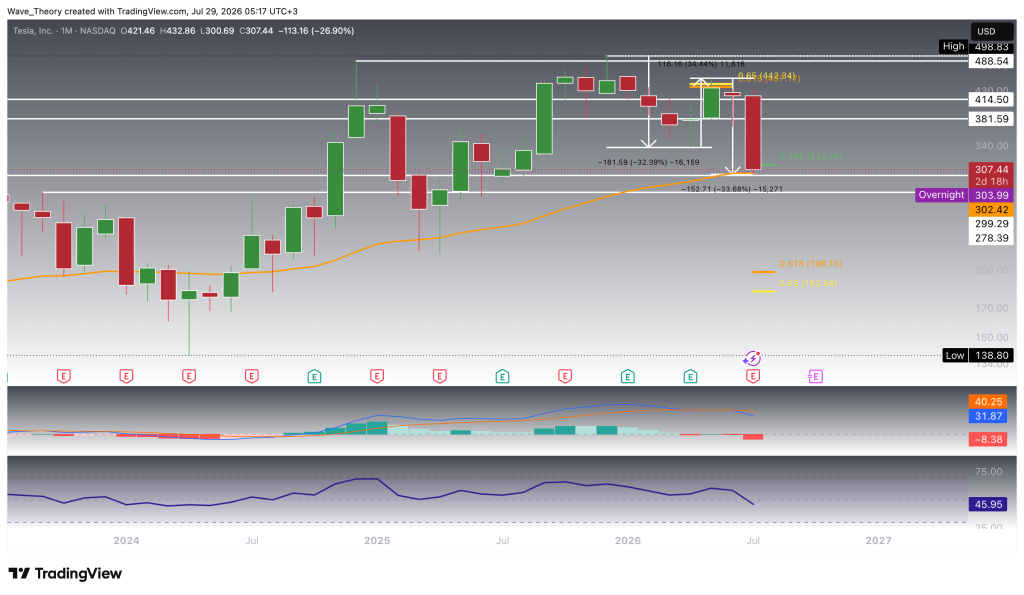
On the monthly chart, TSLA previously declined by approximately 32.4% before reversing higher and advancing around 34.4% to the Golden Ratio resistance at $442.34.
Consequently, Tesla has suffered a sharp correction after failing at the Golden Ratio resistance between $437.17 and $442.34. The stock has now fallen roughly 33.7% from that rejection and is testing the 0.382 Fibonacci support at $313.26.
If this support fails to hold, the next major support zone lies at the Golden Ratio between $182.54 and $198.15, implying additional downside of around 35% from current prices. Before that, however, historical support lies between $278.4 and $299.3.
Despite the recent decline, Tesla continues trading above the 50-month EMA, which currently provides additional dynamic support around $302.42. Momentum indicators, however, continue favoring the bears. The MACD lines remain bearishly crossed, while the MACD histogram has resumed ticking lower, confirming strengthening bearish momentum. Meanwhile, the RSI remains in neutral territory, leaving room for additional downside before reaching oversold conditions.
TSLA Stock Tests Key Weekly Support
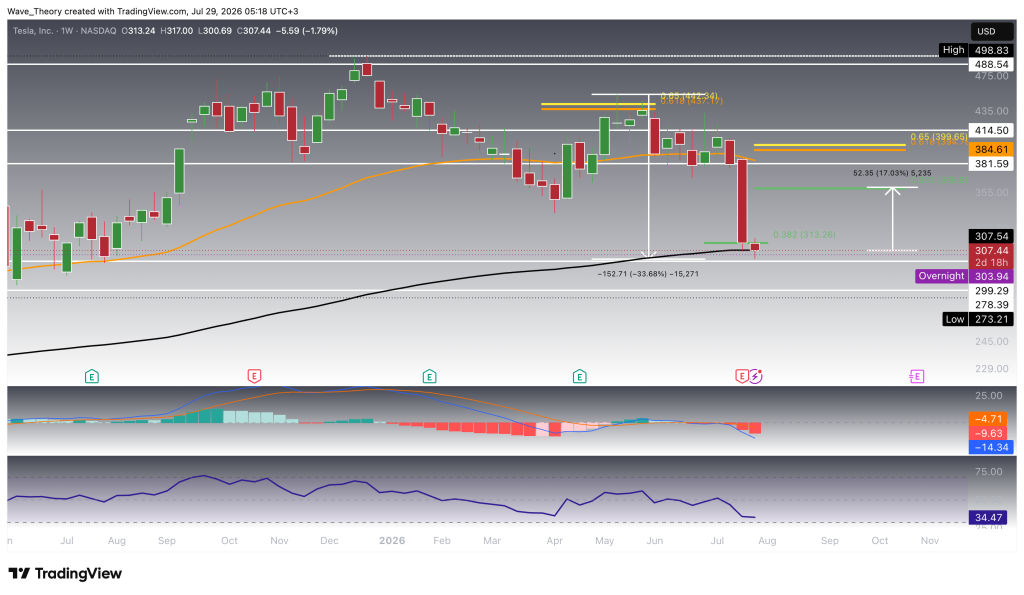
On the weekly chart, Tesla has completed a decisive bearish rejection at the Golden Ratio resistance between $437.17 and $442.34 before collapsing toward the 0.382 Fibonacci support at $313.26.
The stock is currently attempting to stabilize directly above this important support zone. If buyers manage to defend it successfully, Tesla could initially recover toward the 0.382 Fibonacci resistance at $358.85, representing approximately 17% upside from current levels. Above that, the next major resistance remains between $381.59 and $399.65.
A sustained breakdown below $313.26 would significantly weaken the medium-term structure and expose the historical support range between $278.4 and $299.29, followed by the much stronger Golden Ratio support between $182.54 and $198.15.
Momentum continues deteriorating across the weekly timeframe. The MACD lines remain bearishly crossed, while the MACD histogram continues ticking lower, confirming increasing bearish momentum. The EMAs still maintain a golden crossover, preserving the broader bullish trend despite the recent correction. Meanwhile, the RSI moves in neutral territory, suggesting neither bullish nor bearish signals.
Death Cross On The Daily Chart of Tesla Stock Emerges
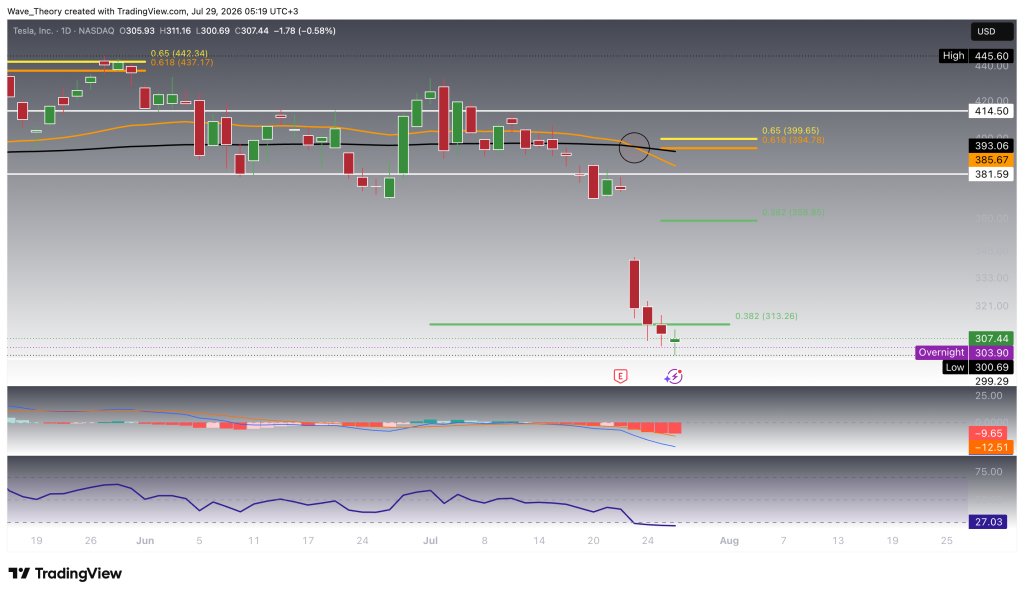
On the daily chart, Tesla remains under heavy technical pressure after breaking decisively below both the 50-day EMA and the 200-day EMA, which now have formed a death cross. This confirms the trend bearishly in the short- to medium term.
The recent earnings-driven sell-off pushed the stock directly toward the 0.382 Fibonacci support at $313.26, where buyers are attempting to stabilize the decline.
Should this support fail, the next downside target remains the Golden Ratio support between $182.54 and $198.15.
On the upside, Tesla would first need to reclaim the resistance zone between $381.59 and $399.65, where both the 50-day EMA and the Golden Ratio resistance converge. To invalidate the ongoing correction phase, TSLA needs to break the 0.382 Fib resistance at $358 and the golden ratio level slightly below the $400 mark.
The momentum indicators continue favoring the bears. The MACD lines remain bearishly crossed, while the MACD histogram continues printing lower bars, confirming persistent downside momentum. The EMAs display a death cross, confirming the bearish trend in the short- to medium term. Meanwhile, the RSI has entered oversold territory, increasing the probability of a technical relief rally.
Tesla Finds Temporary Support at the 0.382 Fibonacci Level
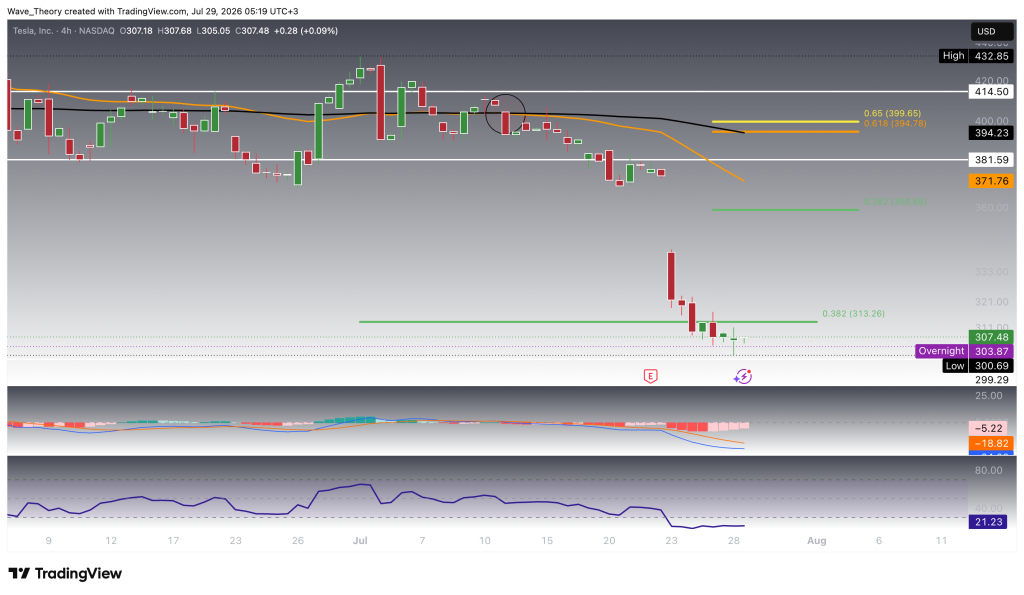
On the 4-hour chart, Tesla appears to be stabilizing after reaching the 0.382 Fibonacci support at $313.26. The first meaningful recovery target sits at the 0.382 Fibonacci resistance at $358.85, followed by the resistance zone between $381.59 and $414.5.
Should the current support fail, Tesla could quickly extend its correction toward the next higher-timeframe support levels.
Momentum indicators remain bearish but are showing early signs of stabilization. The MACD lines remain bearishly crossed, although the MACD histogram has started ticking higher for several consecutive candles, suggesting that bearish momentum is gradually fading. The EMAs continue to display a death cross, confirming that the short-term trend remains bearish. Meanwhile, the RSI has entered oversold territory, leaving room for a short-term relief bounce.
Tesla Price Prediction: Summary
Tesla stock has entered a decisive correction after being rejected at the Golden Ratio resistance between $437.17 and $442.34. The stock is now testing the important 0.382 Fibonacci support at $313.26, which currently represents the first major area where buyers could attempt to establish a durable bottom.
If this support holds, Tesla could initially recover toward $358.85, followed by the resistance zone between $381.59 and $414.5. A successful breakout above these levels would substantially improve the medium-term outlook.
However, a confirmed breakdown below $313.26 would expose the historical support zone between $278.4 and $299.29 before opening the door toward the major Golden Ratio support between $182.54 and $198.15.
While the weekly EMAs continue displaying a golden crossover, confirming that the long-term trend remains constructive, the daily and 4-hour charts exhibit a death cross, reflecting the ongoing short-term bearish momentum. Until Tesla reclaims its key Fibonacci resistance levels, the technical outlook remains cautious despite the stock approaching an increasingly attractive long-term support zone.

Konstantin Kaiser
Financial Writer and Market Analyst
Konstantin Kaiser comes from a data science background and has significant experience in quantitative trading. His interest in technology took a notable turn in 2013 when he discovered Bitcoin and was instantly intrigued by the potential of this disruptive technology.

5 days ago
Add an article to your Reading List
Register now to be able to add articles to your reading list.
” aria-hidden=”true”>
Save