


All global regions experienced investments in gold ETFs in June. In Asia, India led inflows in June, likely supported by rising geopolitical risks in the Middle East.
| Photo Credit:
istock.com
Following a $1.8 billion outflow in May, global physically backed gold exchange-traded funds (ETFs) saw a $38 billion investment in June. The performance in the first half of this year is the strongest in five years, the World Gold Council (WGC) said.
Despite this surge, money managers have reduced their long positions by 28 per cent in the first half, an indication that the gold rush witnessed since 2019 is probably over. Total net longs in COMEX gold futures also fell 23 per cent to 586 tonnes during the same period, but rebounded 6.5 per cent in June compared to May.
India leads inflows
At least three research agencies — BMI, Citibank and Motilal Oswal Wealth Management — have called it quits on the precious metal’s bullish run. Though gold gained over 25 per cent so far this year, it has lost at least 2 per cent in the past week. Currently, spot gold prices are ruling at $3,290.55 an ounce. US gold futures are ruling at $3,297.60. In the Mumbai spot market, gold opened at ₹96,135 per 10 gm compared with ₹96,972 on Tuesday evening. On MCX, gold August futures were quoted lower at ₹96,099 per 10 gm.
On the other hand, money managers increased the positions in June by 11 per cent to 406 tonnes compared with May. “This was likely supported by consolidation in the gold price, providing investors with a window of opportunity to begin rebuilding positions,” the WGC said.
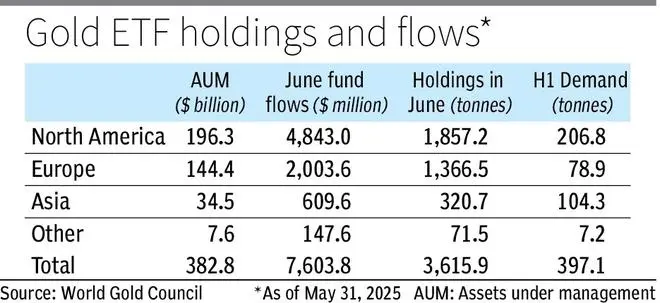
All global regions experienced investments in gold ETFs in June, with investors from North America and Europe leading the charge. In Asia, India led inflows in June, likely supported by rising geopolitical risks in the Middle East.
During the first half of 2025, North America accounted for the bulk of inflows, recording the strongest first half in five years. Despite the pace slowing in May and June, Asian investors invested a record amount in gold ETFs, contributing an impressive 28 per cent to net global flows, with only 9 per cent of the world’s total assets under management (AUM).
AUM 41% higher
European flows finally turned positive in the first half of the year, following non-stop semi-annual losses since the second half of 2022. “By the end of H1, the surging gold price and notable inflows pushed global gold ETFs’ total AUM 41 per cent higher to $383 billion, a month-end record. Collective holdings in H1 grew 397 tonnes to 3,616 tonnes, the highest month-end value since August 2022,” said the council, which represents gold producers.
Inflows in North America were $4.8 billion in June — the strongest monthly investment since March. It increased the H1 inflows to $21 billion. Rising geopolitical risks amid the Israel-Iran conflict boosted investor demand for haven assets and supported inflows into North American gold ETFs. Although US Fed held its rates steady in June, it continued to express concerns about slowing growth and rising inflation. Markets are now pricing in three rate cuts by the end of 2025 and an additional two in 2026.
The WGC said that investors’ response has been swift: US Treasury yields declined, and the dollar continued to weaken. Persistent policy uncertainty and the ongoing fiscal concerns are likely to remain an overhang on the market, which in turn could help support gold ETF demand in the near to medium term.
Bleak growth prospects
European investments continued for a second month, adding $2 billion in June — the strongest since January — and lifting the region’s H1 total to $6 billion. “The UK led inflows in the month, although the Bank of England kept rates unchanged at its June meeting, the stance was generally dovish. Combined with weaker growth, easing inflation and the cooling labour market, investors raised their bets on future rate cuts,” the council said.
This resulted in local yields declining which pushed up gold’s allure. On the other hand, the European Central Bank’s eighth rate cut along with uncertainties surrounding growth and geopolitical risks, contributed to increased demand for gold ETFs in several major markets.
The WGC said Asian flows turned positive in June, though mildly, at $610 million, ending at $11 billion — a record amount for any H1 period. Apart from India, Japan witnessed investments for the ninth consecutive month ($198 million, $1 billion in H1), possibly driven by elevated inflationary concerns, particularly when the rice price surged.
China only saw mild inflows in the month ($137 million) as trade tensions eased and the local gold price moderated. Beijing’s H1 inflows of $8.8 billion (85 tonnes) were at a record high, amid increasing trade risks with the US, growth concerns and the surging price of the yellow metal.
7-year high trade volumes
Funds listed in other regions attracted $148 million in June, pushing H1 inflows to $661 million. Australia and South Africa were the main contributors, both during the month and in H1.
Gold market trading volumes averaged $329 billion a day in the first half, the highest semi-annual value since 2018. But June saw a monthly decline in volumes (-20 per cent), likely impacted by a short-term equity market rally and fading momentum for gold.
Over-the-counter sales in the first half increased to $165 billion a day, above the 2024 average of $128 billion. Exchange-traded volumes also saw a sizeable increase through the first half of the year, averaging $159 billion/day, driven by increased activity on COMEX and the Shanghai Futures Exchange.
Trading volumes of global gold ETFs continued to gain strength in H1, particularly from North America and Asia, which averaged $4.3 billion/day and $0.9 billion/day, respectively.
Published on July 9, 2025