The Japanese yen was in the news recently for creating a short-lived panic sell-off in the global equity markets. The trigger came after the Bank of Japan increased their interest rates to 0.25 per cent on July 31 from its earlier 0-0.1 per cent range.
Incidentally, the very next day, the US Purchasing Managers Index (PMI) data showed a sharp fall to 46.8 in July from 48.5 in the previous month. Towards the end of that week, another data release showed that unemployment in the US shot up to 4.3 per cent in July. Both these data reignited the fear of a recession in the US, thereby increasing the odds for the US Federal Reserve to cut interest rate as early as in its September meeting.
So, rate hike in Japan at a time when the US is getting ready for a rate cut cycle triggered a sharp fall in the USDJPY. The currency pair (USDJPY) fell sharply over 7 per cent from around 153 to 142 after this event. That, in turn, knocked down the global equity markets. The Dow Jones Industrial Average fell about 6 per cent from around 41,000 to 38,500 in the few days following Japan’s rate hike. Japan’s benchmark index tumbled about 20 per cent over the same period.
The major reason cited for this sell-off in the equities is what is called the yen carry trade. Since the interest rates in Japan was at zero for a long time, investors had borrowed money from Japan (in yen) and had invested in high yielding assets such as equities within the country and outside the country as well.
Unconfirmed reports indicate that the yen carry trade could amount to as high as $20 trillion. Some reports also say that a significant part of that carry trade has already unwound.
However, the absolute quantum of the yen carry trade is not known and it is not easy to guess how much further the carry trade could impact global markets. But what we can definitely do is focus on where the yen can go from current levels and, in turn, what would that be the implication on the Nifty and the rupee.
For the purpose of forecasting, we have taken a few key indicators that influence the movement of yen and applied technical analysis on the same.
It is to be noted that the forecast made here is for the long term, say a minimum of one year. So, the path for the target level given for the yen is going to be gradual and not steep as was seen recently.
Here is the analysis.
US-Japan yield differential
The yield differential between two countries is one of the major factors that drives the currency movement. The difference between the US 10 Yr Treasury yield and the Japan 10Yr government bond yield (US 10Yr minus Japan 10Yr yield) has a very strong directional correlation with the USDJPY pair. That is, if the differential increases, the USDJPY moves up and vice-versa. This is evident from the chart below.
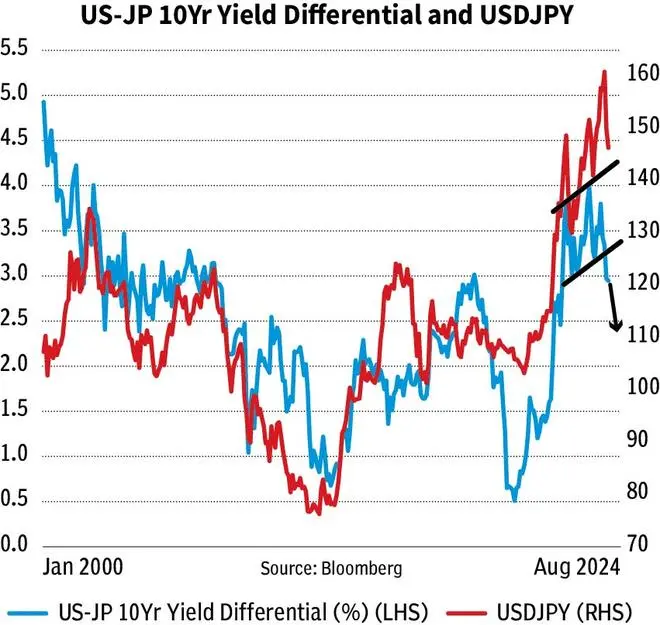
The US-Japan 10Yr yield differential (2.92 per cent) seems to have topped out around 4 per cent and has come down. It is currently at 2.92 per cent. Strong resistance is now at 3.3-3.4 per cent. Immediate support is at 2.9 per cent. A bounce from this support towards 3.3-3.4 per cent cannot be ruled out in the short term. But after that, the differential can fall back again. That leg of move could break the support at 2.9 per cent. Such a break can drag the US-Japan 10Yr yield differential down to 2.4 per cent and even lower.
So, the USDJPY can move up in the short-term if the yield differential goes up to 3.3-3.4 per cent. But eventually, the currency pair can turn down again and see a fresh fall as the differential falls towards 2.4 per cent and lower.
Yen and Fed rate cuts
Interest rate cut in September from the US Federal Reserve is almost a given now. The US Federal Reserve Chairman Jerome Powell in his speech at the Jackson Hole meeting on Friday had said that the time has come to make policy adjustments.
As against the usual 25 basis points (bps) rate cut, some segments of the market is now expecting even a 50-bps cut next month. According to the CME Group’s FedWatch tool, the probability of a 25-bps rate cut in September is 76 per cent. It also shows a 53 per cent probability for another 25-bps cut in November. But the US Fed, in its economic forecast released in June, has projected only for one rate cut this year.
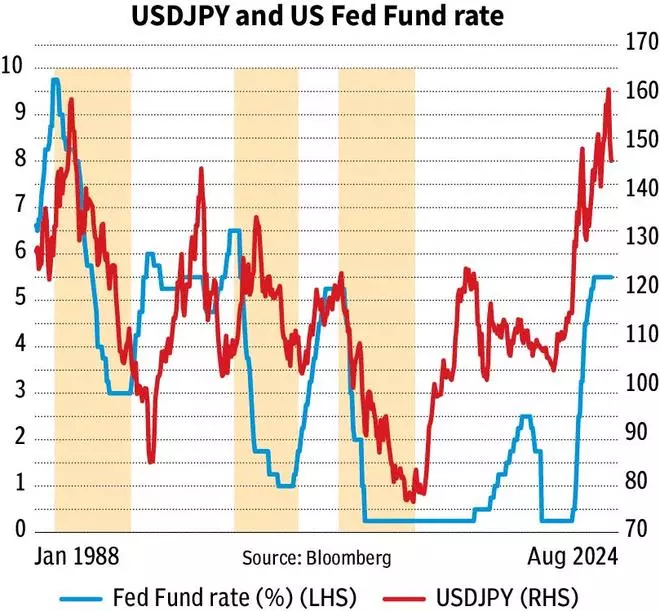
Whatever the case may be, the US is now entering into the rate cut cycle. As seen from the chart above, the earlier instances of rate cuts from the Fed has taken the USDJPY pair lower all along the rate cut cycle. Although the fall in the USDJPY had begun with a lag in some instances, ideally the currency pair had been knocked down badly.
So, as the Fed begins to cut rates, the USDJPY could be heading for more fall, going forward. The quantum of fall in the USDJPY will depend on how long the rate cut cycle remains.
Inflation in Japan
Japan’s Consumer Price Index (CPI) had peaked in January 2023 and has been coming down. The CPI touched 4.3 per cent in January 2023 and is now at 2.8 per cent as of July this year. The Bank of Japan projects CPI to be at 2.5 per cent in 2025.
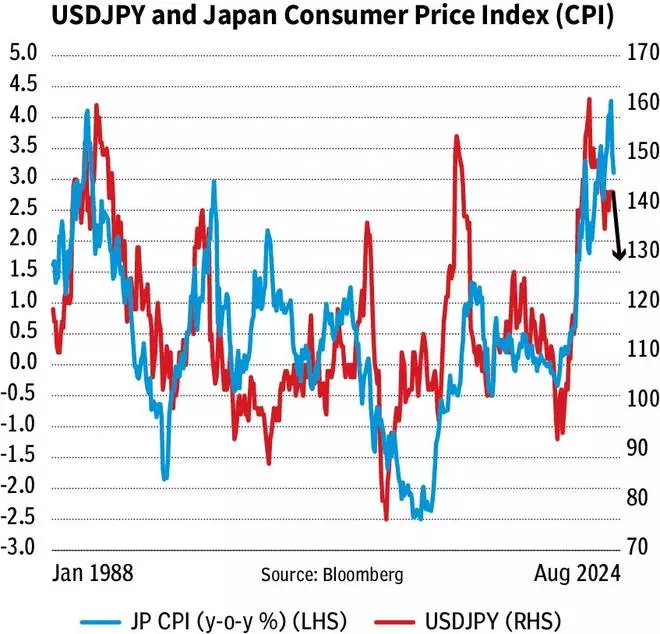
However, as seen from the chart above, the fall in CPI has taken multiple years to find a bottom. So, Japan’s CPI may have more room on the downside from here. It can probably come down to 1.5-1 per cent and even lower over the years.
The USDJPY has a strong directional correlation with the CPI. So, the multi-year fall expected in Japan’s CPI can continue to take the USDJPY also lower along with it in the coming years.
On the charts
All the factors mentioned above indicate that the USDJPY pair is likely to see more fall, going forward. To know how much it can fall, we take a look at the USDJPY pair price chart and do an independent analysis.
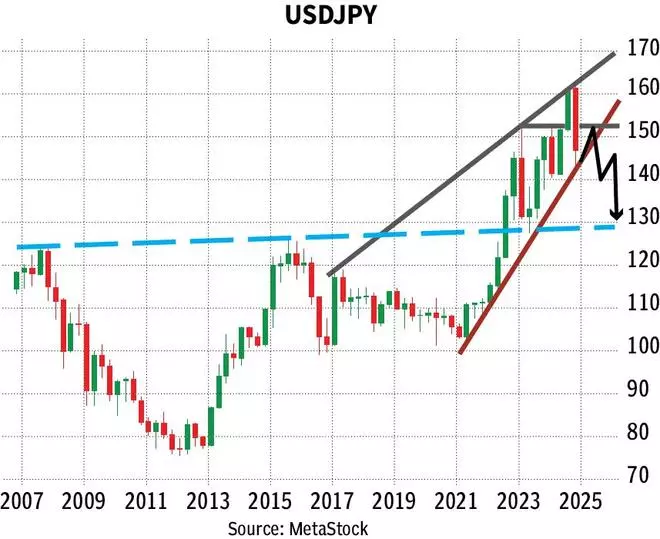
The sharp fall below 150 after the Bank of Japan rate hike has turned the outlook bearish for the USDJPY pair. The strong bounce back move from the low of 141.66 has also failed to sustain. The pair has come down again from around 150 over the last couple of weeks.
Immediate resistance is at 150. Above that, strong resistance is in the 151-152 region. Support is now at 144. A sideways consolidation between 144 and 150 or 152 is a possibility for a month or two.
Eventually, we can expect the USDJPY to break 144 in the coming months. Such a break would be very bearish. It can take the USDJPY pair down to 130-128 over the next one year.
Intermediate support below 144 are at 139 and 132. So, the path forward could be as follows:
* First a consolidation between 144 and 152 for a few months now
* Then break 144 and fall to 139
* After that, see a corrective bounce from 139 to 144-145 or even 148.
* And finallly, fall back from around 145 or 148 to 132-130
* In case the support at 132 holds on its first test, then a corrective bounce from 132 to 136-137 is a possibility before falling back to 130-128.
What the fall in USDJPY will mean for the Indian markets
Nikkei 225 and Nifty 50
To know the impact of the fall in the USDJPY to 130-128 on the Nifty 50, we first see where the Nikkei 225 can go from here.
The USDJPY and Nikkei 225 have a strong directional correlation. So, if the USDJPY falls to 130-128, going forward, Nikkei 225 can also fall along with it.
On the charts, Nikkei has strong resistance around 42,000-43,000. A rise past 43,000 is less likely now. The possibility of a short-term rise to 150-152 on the USDJPY can take the Nikkei 225 also higher towards 42,000-43,000 in the next few months.
On the downside, as long as the Nikkei 225 stays below 43,000, it has the potential to target 33,000 and even 31,000 eventually.
A ratio analysis between the Nikkei 225 and Nifty 50 can help in determining where our domestic benchmark index can go based on the fall projected in the Nikkei.
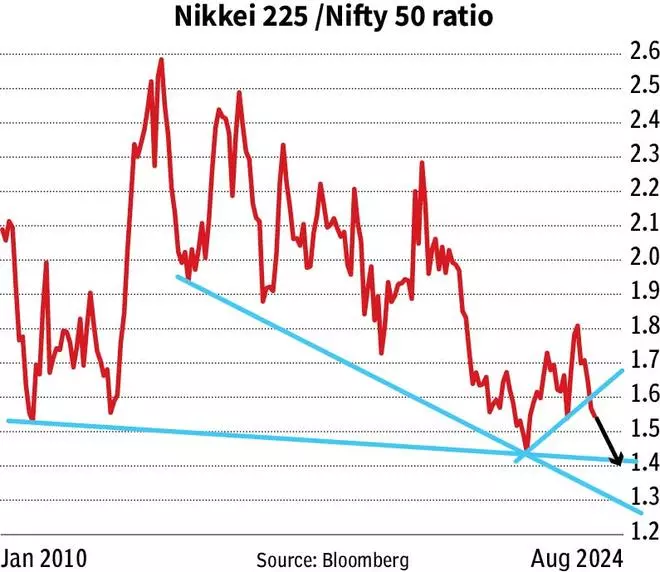
The Nikkei 225/Nifty 50 ratio is currently at 1.55. It can rise to 1.6 from here. So, if the Nikkei goes up towards 43,000, then Nifty 50 can rise to 26,875 in order to take the ratio up to 1.6.
Eventually, the ratio can turnaround from 1.6 and fall to 1.4-1.3 over the long term. So, as the Nikkei comes down to 31,000, Nifty 50 can fall to 23,850 or 22,150 to bring the ratio down towards 1.4-1.3.
So, broadly the path of move for the Nifty could be to see a rise to 26,875 and then fall towards 23,850 or 22,150. Please note that the levels arrived on the Nifty are purely based on the ratio analysis
Yen and rupee
We try to arrive as to where the Indian rupee (USDINR) is headed by making a forecast for the JPYINR Cross first. The JPYINR, currently at 0.58, has risen back very well from around 0.52 recently. Failure to sustain the fall below 0.54 and a strong bounce from 0.54 is a positive. That leaves the chances high for the JPYINR Cross to break the immediate resistance at 0.59. Such a break can take the Cross up to 0.64 initially and then to 0.70 eventually over the long term.
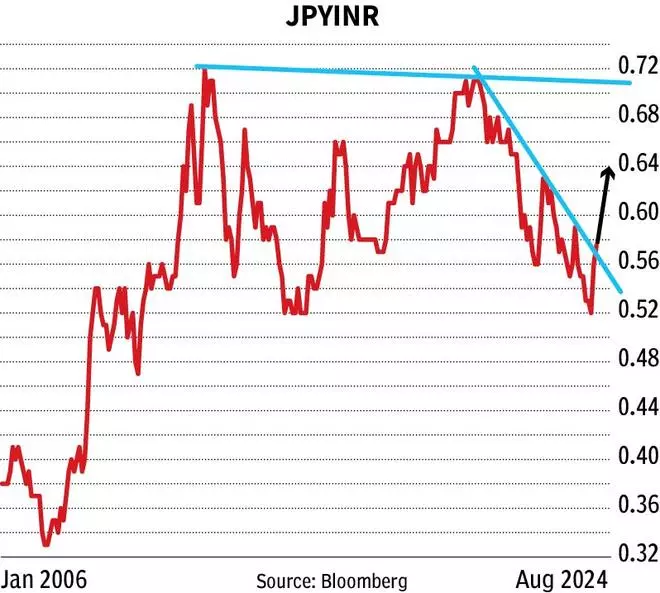
So, if the JPYINR moves up to 0.64 and the USDJPY falls to 139, then rupee can fall to 89. Then as the JPYINR goes up to 0.70 and the USDJPY falls to 132, then that would drag the Indian rupee to 92.40. From a long-term perspective, we can expect the rupee to decline below 90.

