

Primary count: Potential bottom in wave (C) signals reversal
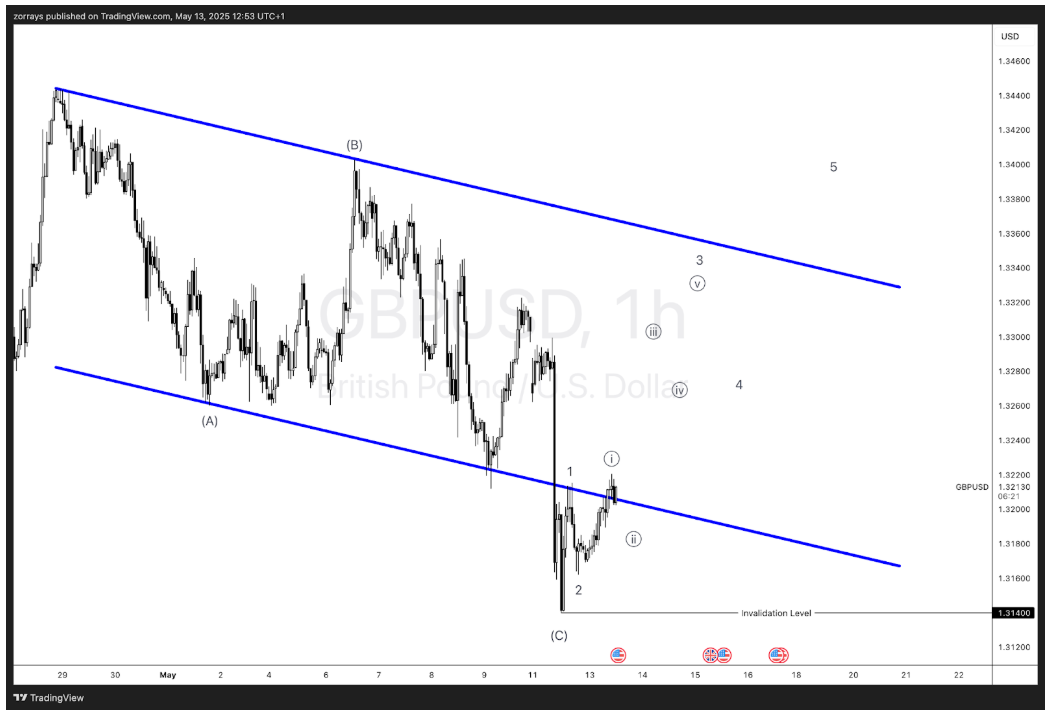
The GBP/USD 1-hour chart presents a compelling Elliott Wave structure, suggesting the potential completion of a corrective Wave (C) at the recent low near the 1.3140 region. According to the primary count, this could mark a significant inflection point, indicating that the pair may have bottomed out and is beginning a new impulsive rally.
This bullish shift coincides with macroeconomic commentary from Huw Pill, the Chief Economist at the Bank of England, who on Tuesday expressed concerns about inflationary pressures in the UK. Speaking at a London School of Economics conference, Pill emphasized:
“There is a risk that inflation could remain above the BoE’s 2% target longer than expected, necessitating more persistent monetary policy tightening.”
This hawkish narrative underscores the central bank’s vigilance. It strengthens the case for maintaining higher interest rates for longer, possibly catching markets off guard and fueling GBP strength as rate expectations shift.
Elliott Wave breakdown of primary count
- The structure off the lows indicates a clean 5-wave progression, suggesting a possible start to a new bullish cycle.
- The invalidation level at 1.3140 must hold to keep this bullish wave structure intact.
- Current price action has breached the internal channel, indicating strength.
- As wave (ii) likely completes, a sharp wave 3 rally could follow toward 1.33+.
Key technical zone to watch
Break and hold above the descending channel and key resistance zones (~1.3220–1.3240) would validate this bullish wave structure, propelling GBP/USD higher toward the 1.3360–1.3440 region.
Alternative count: Complex correction still in play if inflation eases
While the primary scenario looks increasingly probable, an alternative Elliott Wave count suggests a more cautious outlook. If upcoming UK inflation data surprises to the downside, it could ease pressure on the BoE, tempering rate hike expectations.
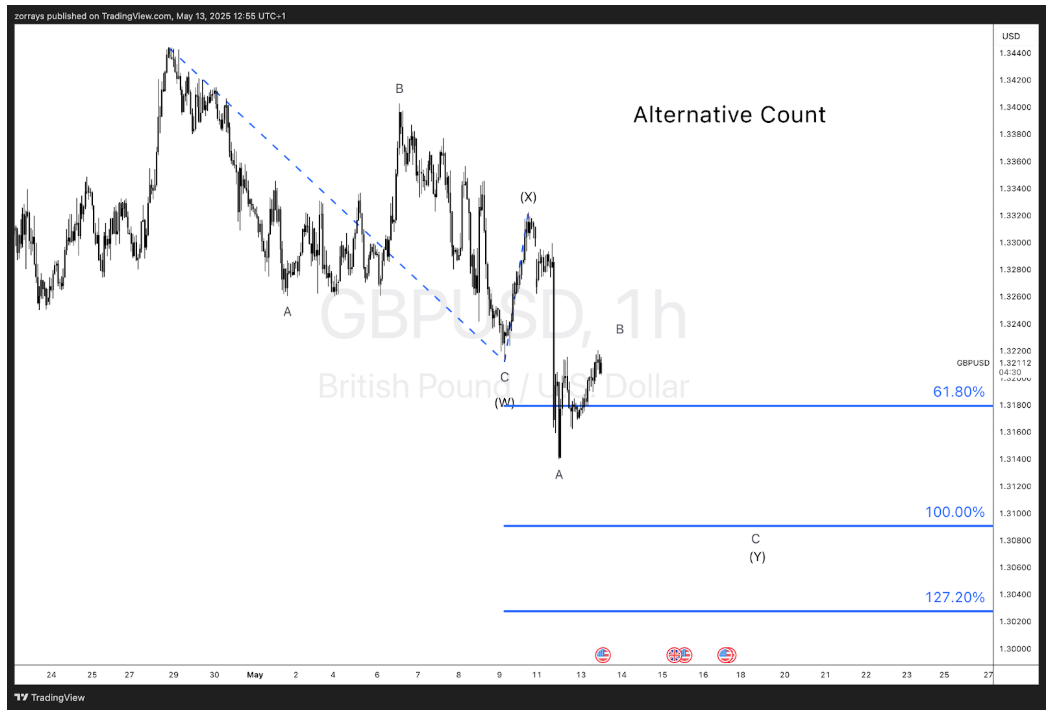
This would align with a complex W-X-Y correction still unfolding:
- The move higher from the lows could represent an internal wave B of the larger (Y) correction.
- If this unfolds, the pair may still be headed lower to complete wave C of (Y).
- Fibonacci projections indicate potential targets at:
-
- 61.8% retracement near 1.3180 (initial support)
- 100% extension near 1.3100
- 127.2% extension near 1.3040
Risk scenarios for bulls
- A failure to sustain gains above 1.3220 and a breakdown below 1.3140 would invalidate the bullish scenario.
- This would point to continued downside as part of a larger correction before the next sustainable rally.