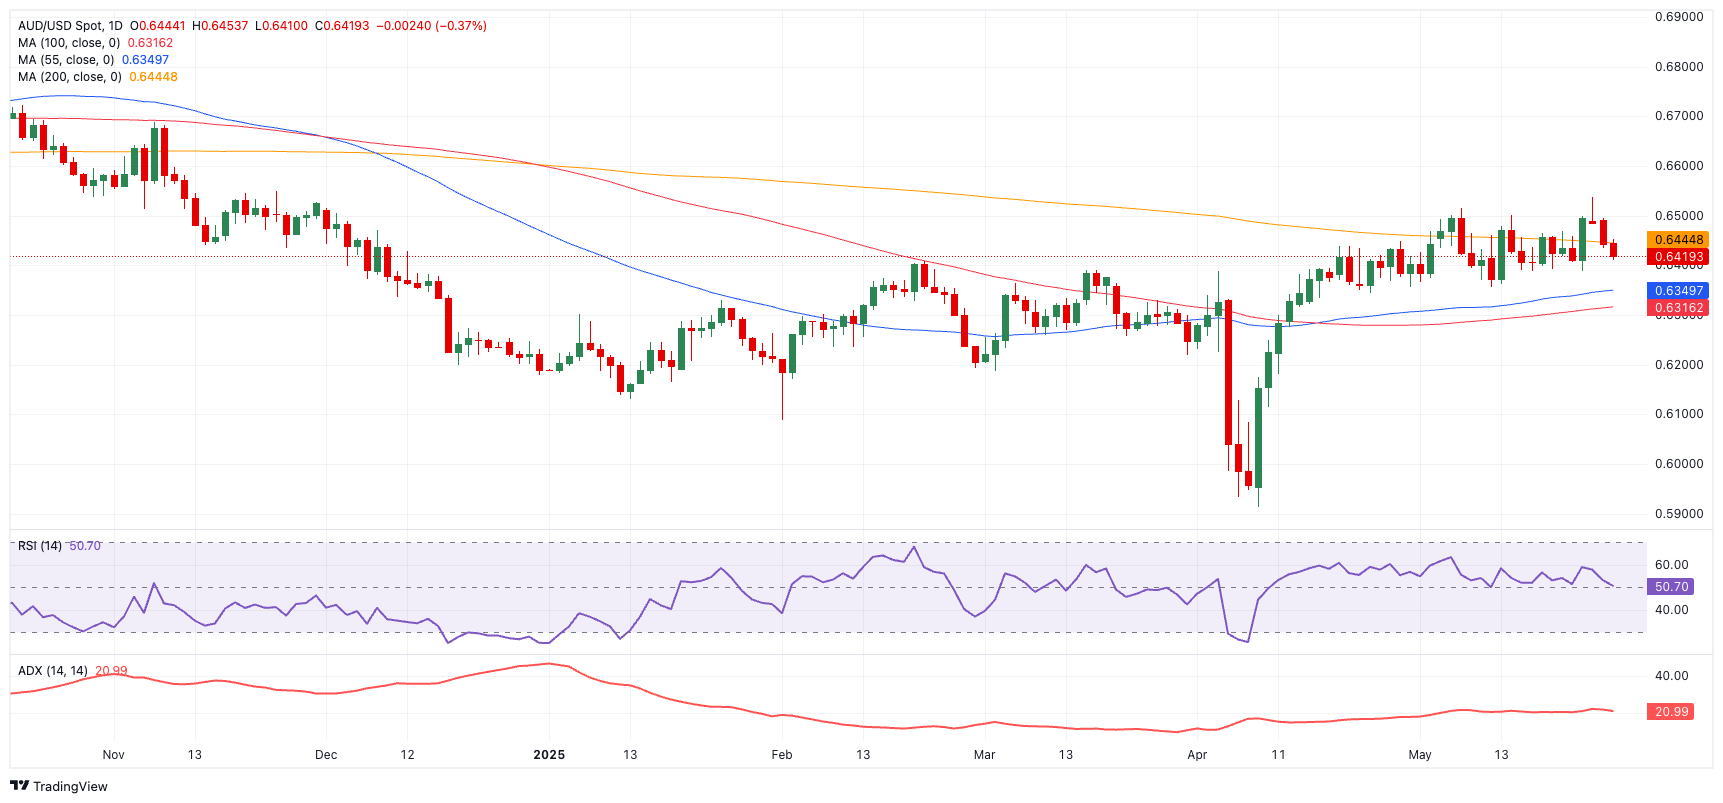
- AUD/USD retreated for the third consecutive day, confronting the 0.6400 support.
- The US Dollar extended further its weekly recovery on trade optimism.
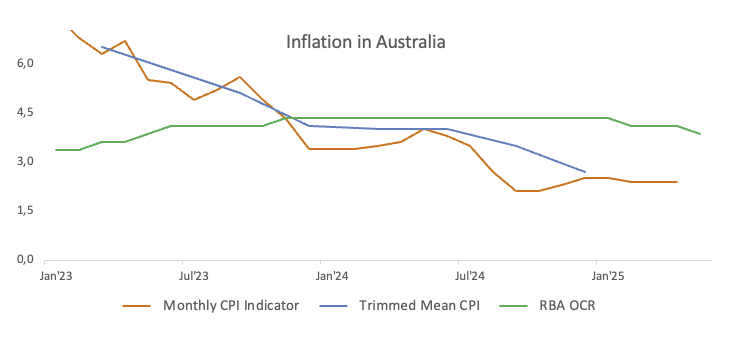
- The RBA’s Monthly CPI Indicator came in at 2.4% in April, in line with forecasts.
Further weakness saw the Australian Dollar (AUD) add to its weekly correction, prompting AUD/USD to clinch its third daily pullback in a row, this time coming just pips away from the key support at .6400 the figure.
That said, the pair has so far given away more than a cent since Monday’s yearly highs in the 0.6530-0.6540 band. Furthermore, spot also extended its recent breach below its critical 200-day SMA around 0.6450, a development that is a harbinger of potential extra pullbacks in the short-term horizon.
The pair’s drop occurred in reaction to the continued appreciation of the US Dollar, as investors continued to respond to President Trump’s decision to postpone the imposition of tariffs on EU exports, while optimism on potential trade agreements with other countries also helped the sentiment.
Monetary policy divergence influences the AUD/USD narrative
Meanwhile, the growing divergence between the Federal Reserve (Fed) and the Reserve Bank of Australia (RBA) has emerged as another factor influencing spot price movement.
Chair Jerome Powell maintained a cautious, data-dependent tone even after the Fed opted to hold rates unchanged at its May meeting. Softer inflation statistics in April, along with an increase in risk appetite, have prompted markets to expect a rate cut by September.
On May 20, the RBA cut the official cash rate by 25 basis points, bringing it down to 3.85%. The central bank’s accompanying Monetary Policy Report (MPR) predicted that the OCR would fall to 3.2% by 2027, implying that much more easing was to come.
Despite admitting that policy settings had become “somewhat less restrictive”, officials emphasised the remaining uncertainty surrounding local demand and global supply networks.
With inflation expected to fall close to 2.6%, the RBA trimmed its inflation outlook and its 2025 GDP growth forecast to 2.1%.
Still around inflation, the RBA’s Monthly CPI Indicator held steady at 2.4% in April.
China’s backing is decreasing due to structural challenges
Recent numbers from China were a mixed bag for the Aussie. Although industrial production surpassed expectations, low fixed asset investment and falling retail sales suggest a slowdown in the January-March quarter. Nonetheless, the total growth path is on track for a 5% increase in Q2.
On a gloomy note, China’s property market is volatile, and US trade policy is unpredictable and has a significant impact on everything. On May 20, the People’s Bank of China cut the 1-year and 5-year Loan Prime Rates by 10 basis points to 3.00% and 3.50%, indicating a dovish stance.
Positioning: Bearish bias with room for doubts
CFTC figures released on May 20 revealed a resurgence of bearish bets against the Australian currency. In fact, net short positions reached at little over 59K contracts, the highest level in the past four weeks. Though a decline in open interest may indicate a less pessimistic outlook, speculative sentiment remains cautious.
Technical landscape
A clean push over the 200-day SMA at 0.6448 will decide if AUD/USD can sustain its bullish breakthrough.
The next major resistance levels are the 2025 peak of 0.6537 (May 26), seconded by the November 2024 high of 0.6687 (November 7), and the 2024 top of 0.6942 (September 30).
On the downside, first support is at the May low of 0.6356 (May 12), with further contention at the transitory 55-day and 100-day SMAs of 0.6348 and 0.6314, respectively. A more complete correction might send the pair down towards the 2025 bottom at 0.5913 (April 9), perhaps revisiting the pandemic low of 0.5506 (March 19, 2020).
Momentum indicators suggest a little downward tilt: The Relative Strength Index (RSI) has eased to nearly 51, and the Average Directional Index (ADX) is over 22, indicating a steady but not conclusive strength of the trend.