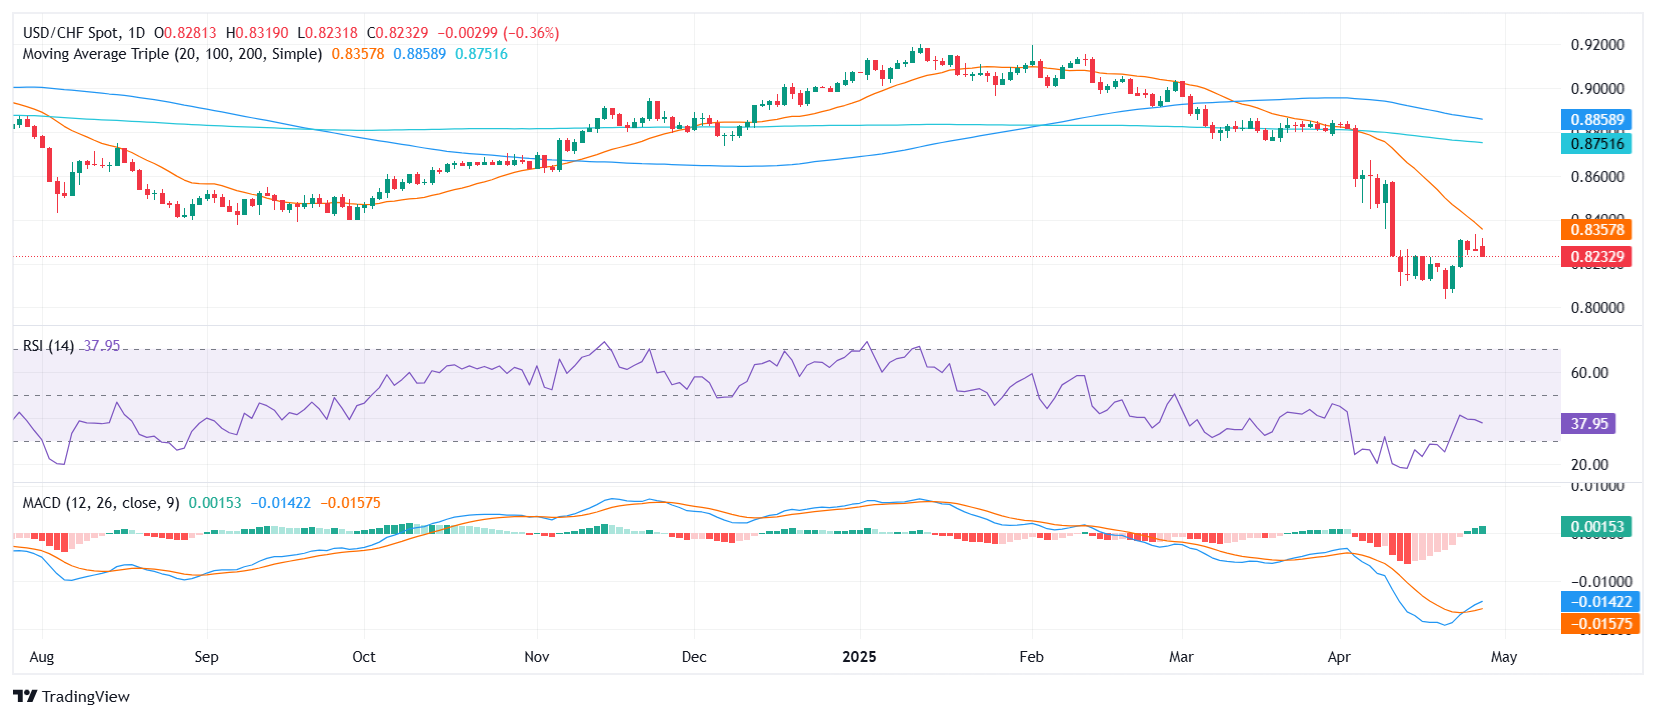
- USD/CHF trades near the lower end of its daily range on Monday after a notable decline.
- Bearish signals dominate with downward pressure from key moving averages.
- Technical levels point to support near 0.8210 and resistance around 0.8315.
During Monday’s session, USD/CHF was seen trading near the lower end of its daily range, moving around the 0.82 area after dropping by nearly half a percent. The pair continues to face a bearish overall sentiment, reinforced by the performance of technical indicators. Despite the Relative Strength Index (RSI) standing neutral around 38 and the Moving Average Convergence Divergence (MACD) hinting at a mild buy signal, broader signals from the Simple Moving Averages (SMAs) and Exponential Moving Averages (EMAs) remain firmly tilted towards selling.
The bearish tone is particularly emphasized by the 20-day SMA positioned around 0.8358, as well as the 100-day and 200-day SMAs hovering well above the current trading area at 0.8854 and 0.8750 respectively, all signaling a continued downside bias. Furthermore, short-term EMAs, with the 10-day at approximately 0.8259 and the 30-day near 0.8452, also strengthen the bearish outlook.
Meanwhile, other momentum indicators such as the Williams Percent Range (14) at around -64 and the Stochastic RSI Fast hovering above 90 are sending more neutral signals, suggesting that while downside pressure is strong, short-term volatility could persist.
On the levels front, immediate support lies close to the 0.8210 zone, with stronger layers of resistance aligned near 0.8259, 0.8302, and 0.8315. These levels could define the trading boundaries in the short term as the pair reacts to prevailing market forces.
In conclusion, Monday’s action highlights a continuation of the bearish sentiment for USDCHF, driven largely by the weight of the moving averages, despite some neutral signs from oscillators. Traders will be keeping a close eye on whether the support around 0.8210 holds or if the pair stages a corrective rebound towards the resistance clusters identified above.
Daily Chart