

- AUD/USD attracts some follow-through buying on Monday amid a broadly weaker USD.
- US fiscal concerns and dovish Fed expectations drag the USD to over a one-month low.
- US-China trade tensions and geopolitical risks might cap further upside for the Aussie.
The AUD/USD pair builds on Friday’s strong move up and climbs further beyond the 0.6500 psychological mark, touching its highest level since November 2024 at the start of a new week. Rising uncertainty surrounding the US fiscal deficit, along with dovish Federal Reserve (Fed) expectations, drags the US Dollar (USD) to over a one-month low, which, in turn, is acting as a tailwind for the currency pair.
US President Donald Trump’s dubbed “Big, Beautiful Bill” was passed in the lower house last week and will be voted on in the Senate this week. The sweeping tax and spending legislation would add an estimated $4 trillion to the federal primary deficit over the next decade, fueling worries that the US budget deficit could worsen at a faster pace than previously expected. Apart from this, bets that the Fed will lower borrowing costs continue to weigh on the Greenback.
Softer-than-expected US Consumer Price Index (CPI) and Producer Price Index (PPI) released earlier this month pointed to signs of easing inflationary pressures. Adding to this, a weak US economic outlook, amid the uncertainty surrounding US President Donald Trump’s trade policies, might force the Fed to eventually step in to support growth. In fact, traders are currently pricing in the possibility of at least two 25 basis points Fed rate cuts by the end of this year.
Meanwhile, Trump’s decision to delay the implementation of a 50% tariff on the European Union from June 1 until July 9 boosts investors’ confidence. This is evident from a generally positive tone around the equity markets, which is seen as another factor undermining the safe-haven buck and benefiting the perceived riskier Aussie. That said, US-China trade tensions and persistent geopolitical risks might keep a lid on the market optimism and the Australian Dollar (AUD).
China accused the US of abusing export control measures and violating preliminary trade agreements reached in Geneva after the latter issued guidance warning companies not to use Huawei’s Ascend AI chips. Moreover, China’s Commerce Ministry warned of legal action against individuals or organizations implementing US export restrictions. This, in turn, highlights tensions between the world’s two largest economies and warrants some caution for the AUD bulls.
Apart from this, the Reserve Bank of Australia’s (RBA) dovish 25 bps rate cut last week might further contribute to capping the AUD/USD pair. Traders might also opt to wait for this week’s release of the latest consumer inflation figures from Australia and important US macro data, including the Prelim GDP print and the Personal Consumption Expenditure (PCE) Price Index. Apart from this, the FOMC meeting minutes will influence the USD and provide a fresh impetus to spot prices.
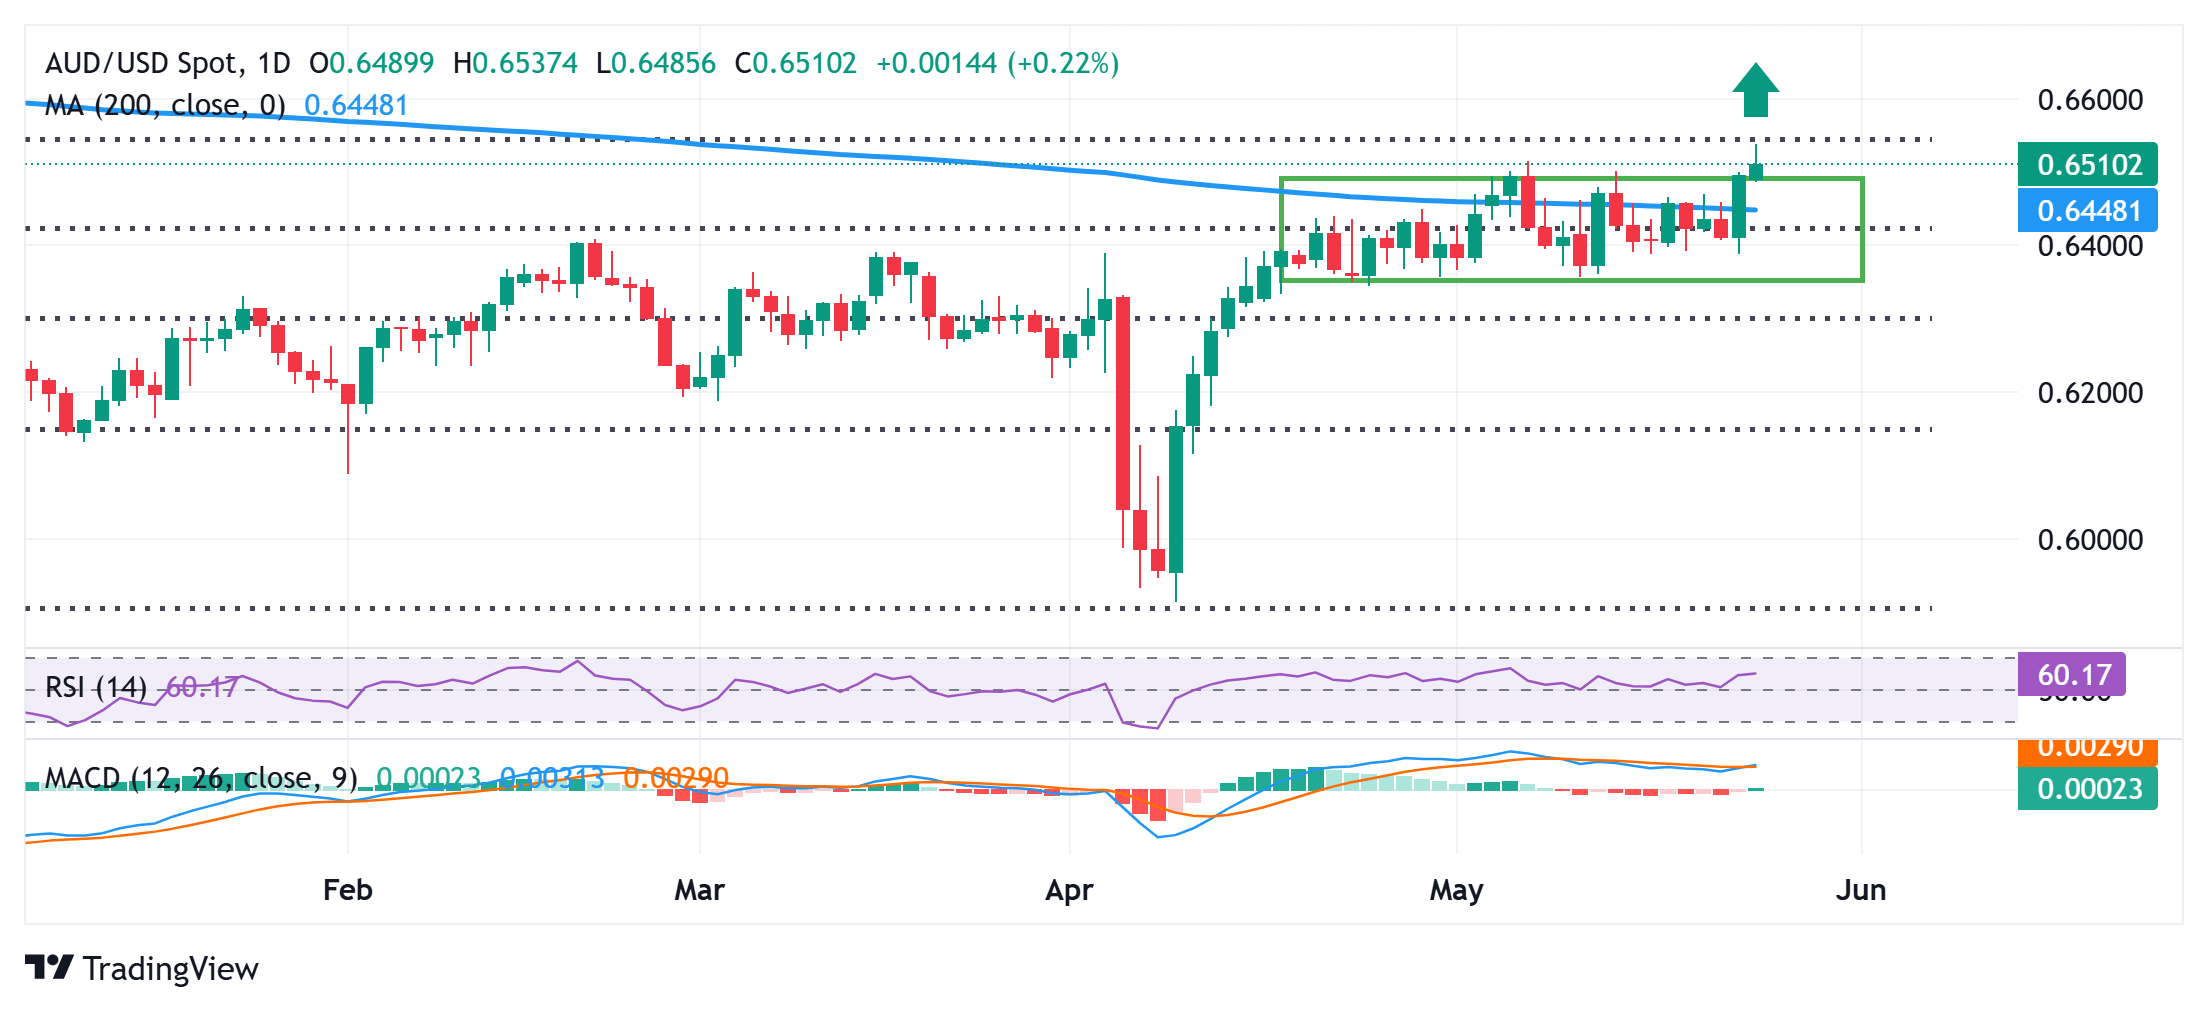
AUD/USD daily chart
Technical Outlook
From a technical perspective, Friday’s close above the 200-day Simple Moving Average (SMA) and a subsequent breakout through a short-term trading range favor bullish traders. Moreover, oscillators on the daily chart have been gaining positive traction and are still away from being in the overbought zone. This, in turn, suggests that the path of least resistance for the AUD/USD pair is to the upside.
However, it will be prudent to wait for some follow-through buying beyond the daily swing high, around the 0.6540-0.6545 region, which coincides with the 61.8% Fibonacci retracement level of the September 2024-April 2025 downfall, before positioning for further gains. The AUD/USD pair might then aim to reclaim the 0.6600 mark and climb further towards testing the 0.6640 resistance zone.
On the flip side, any corrective slide below the 0.6500 psychological mark might now be seen as a buying opportunity and remain cushioned near the 0.6455-0.6450 area, or the 200-day SMA. This is followed by a strong horizontal support near the 0.6400-0.6390 region. A convincing break below the latter might shift the near-term bias in favor of bearish traders and pave the way for deeper losses.