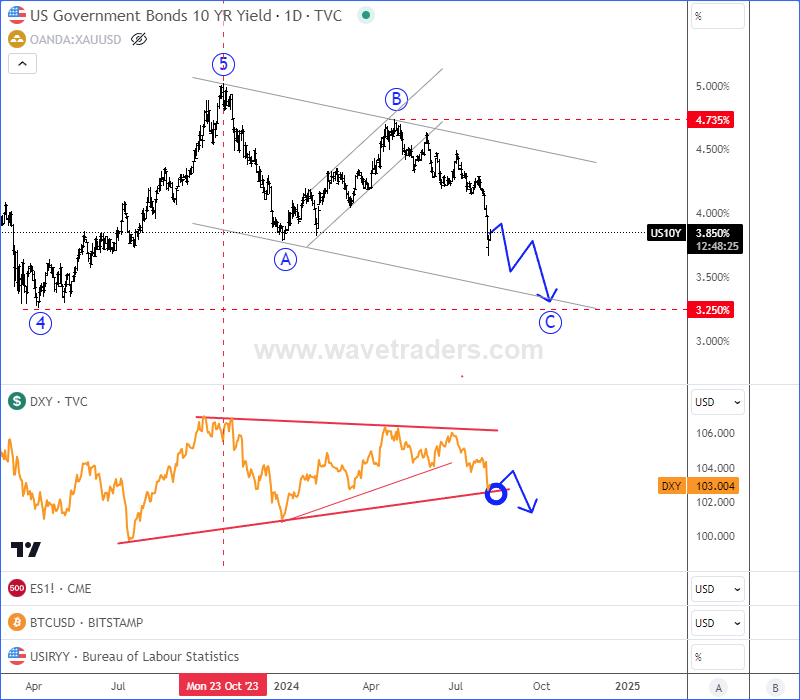
We have been talking a lot about bearish US Yields and bearish USDollar Index – DXY in the last couple of weeks, as they are in positive correlation. We also shared a content back in June 28, where we spotted strong resistance for US Yields and DXY, from where we can now see nice and strong bearish price action with room for much lower levels.
As you can see to day on August 07, 10Y US Yields are falling impulsively within wave C as expected and there can be space even down to 3.25%. If we consider a positive correlation with USdollar Index – DXY, then more weakness can be seen. Is DXY trying to break bearish triangle?
10Y US Yields vs. DXY Daily Chart
Get Full Access To Our Premium Elliott Wave Analysis For 14 Days. Click here.


