

Despite the turbulent news cycle of Q2, the equities market has made an excellent recovery from their lows.
Between the stories of tariffs, geopolitical conflicts, and war tensions, the markets appear to, well, simply no longer care about these stories and continue trotting to new highs. On top of that, Federal reserve rate cuts appear to be just around the corner.
As veterans of the game know, the market likes to price in future expectations. So in Q3, we may just be seeing that — a final push higher in anticipation of the cuts, in September.
According to the CME FedWatch Tool, there’s currently a 66.2% probability of a rate cut in September, the highest among all remaining meetings of 2025. In December, the rates are expected to reach 4.00% — an average expectation of 2 rate cuts before end of year.
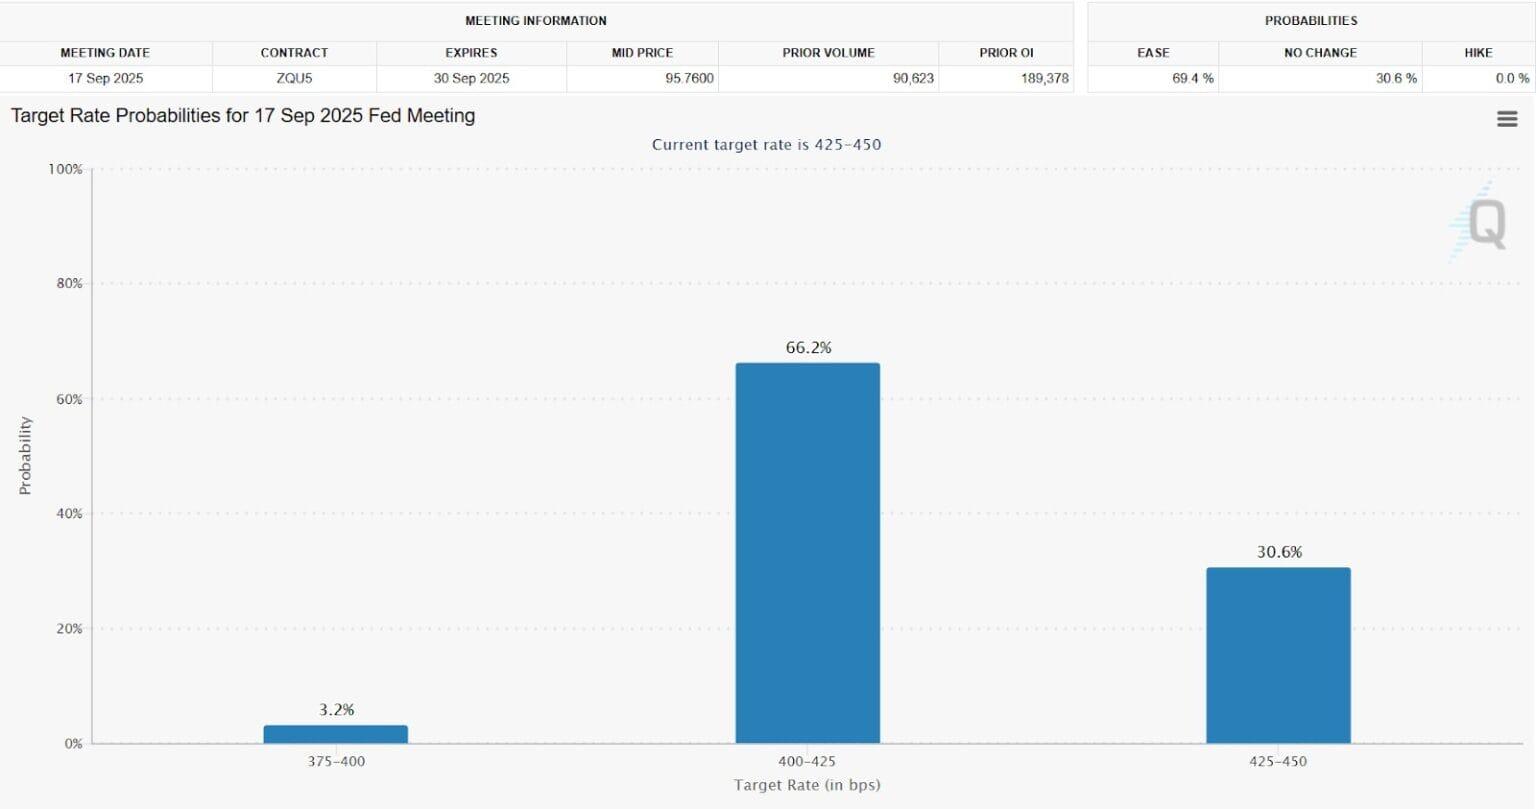
Source: Fedwatch Tool
So this brings up a very interesting thought… is the Fed Pivot story back?
As we delve deeper into the charts, you’ll notice that most of these indices are completing a major 5-wave uptrend structure, which in Elliot Wave Theory, begets the beginning of an ABC 3-wave correction.
This aligns perfectly with the Fed Pivot story, which amazingly, is also hidden from public discussion now. This only gives me more reason to believe that Q3 or Q4 will create the blow-off top.
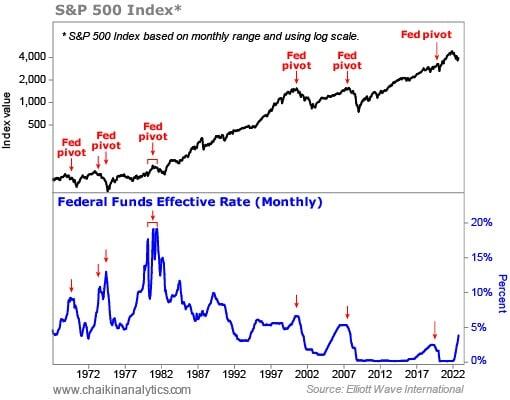
Fed Pivot: Refers to a major shift in the U.S. Federal Reserve’s monetary policy stance — typically from tightening (raising rates or reducing the balance sheet) to easing (cutting rates or pausing hikes). Markets often anticipate this pivot before it happens, as it can mark the end of restrictive policy and the beginning of more accommodative conditions, usually in response to slowing economic growth or easing inflation.
Q3 targets for S&P 500 analysis
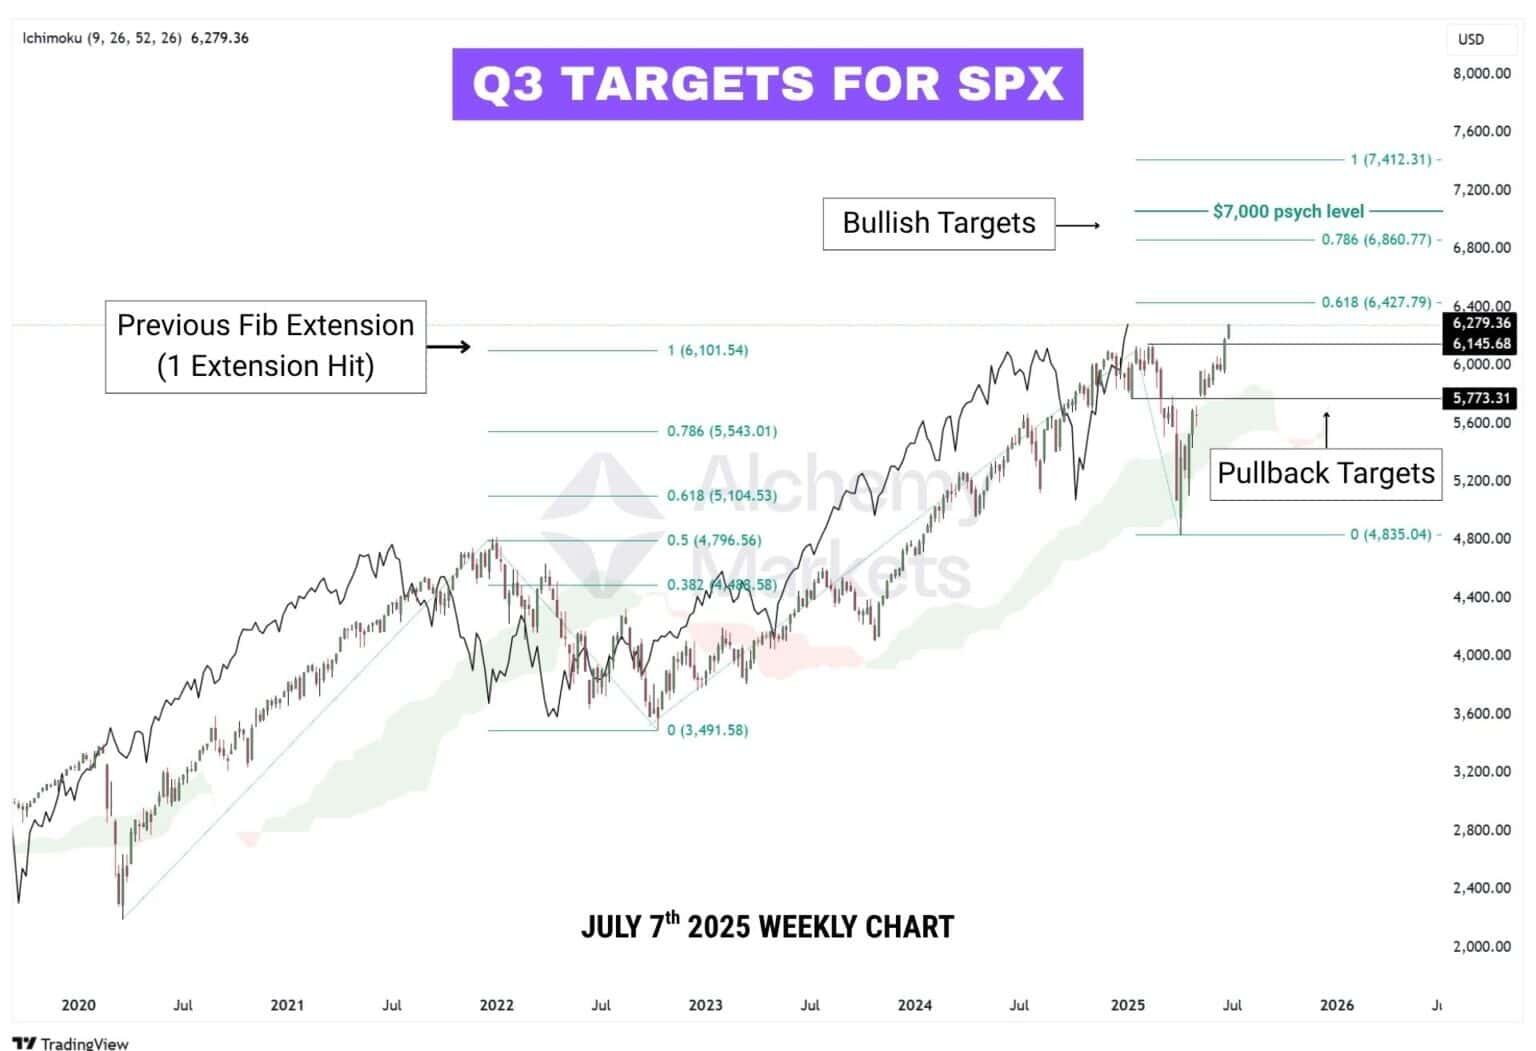
SPX has made a strong recovery, but it’s unrealistic to expect a straight shot to new highs without a breather. If a pullback does occur, the Ichimoku Chikou Span (lagging span) suggests a key level to watch: the week of July 28th must not close below the prior all-time high of $6,145.68.
A weekly close under this could trigger a deeper retracement toward $5,773, where key price structure and the Ichimoku cloud aligns, leading to roughly an 8% correction, which would still be considered healthy.
On the bullish side, we’ve mapped out Fibonacci extension levels, following a possible 5-wave advance:
These levels act as reference points for where the market may head during a continuation leg higher.
However, one concern is how quickly Wave 4 played out. In Elliott Wave Theory, Wave 4 typically takes longer to form. If the recent dip wasn’t a valid Wave 4, then the current move may not be Wave 5.
In that case, Q3 could see further upside — but the true blow-off top may be deferred to Q4 instead.
Q3 targets for NAS100 analysis
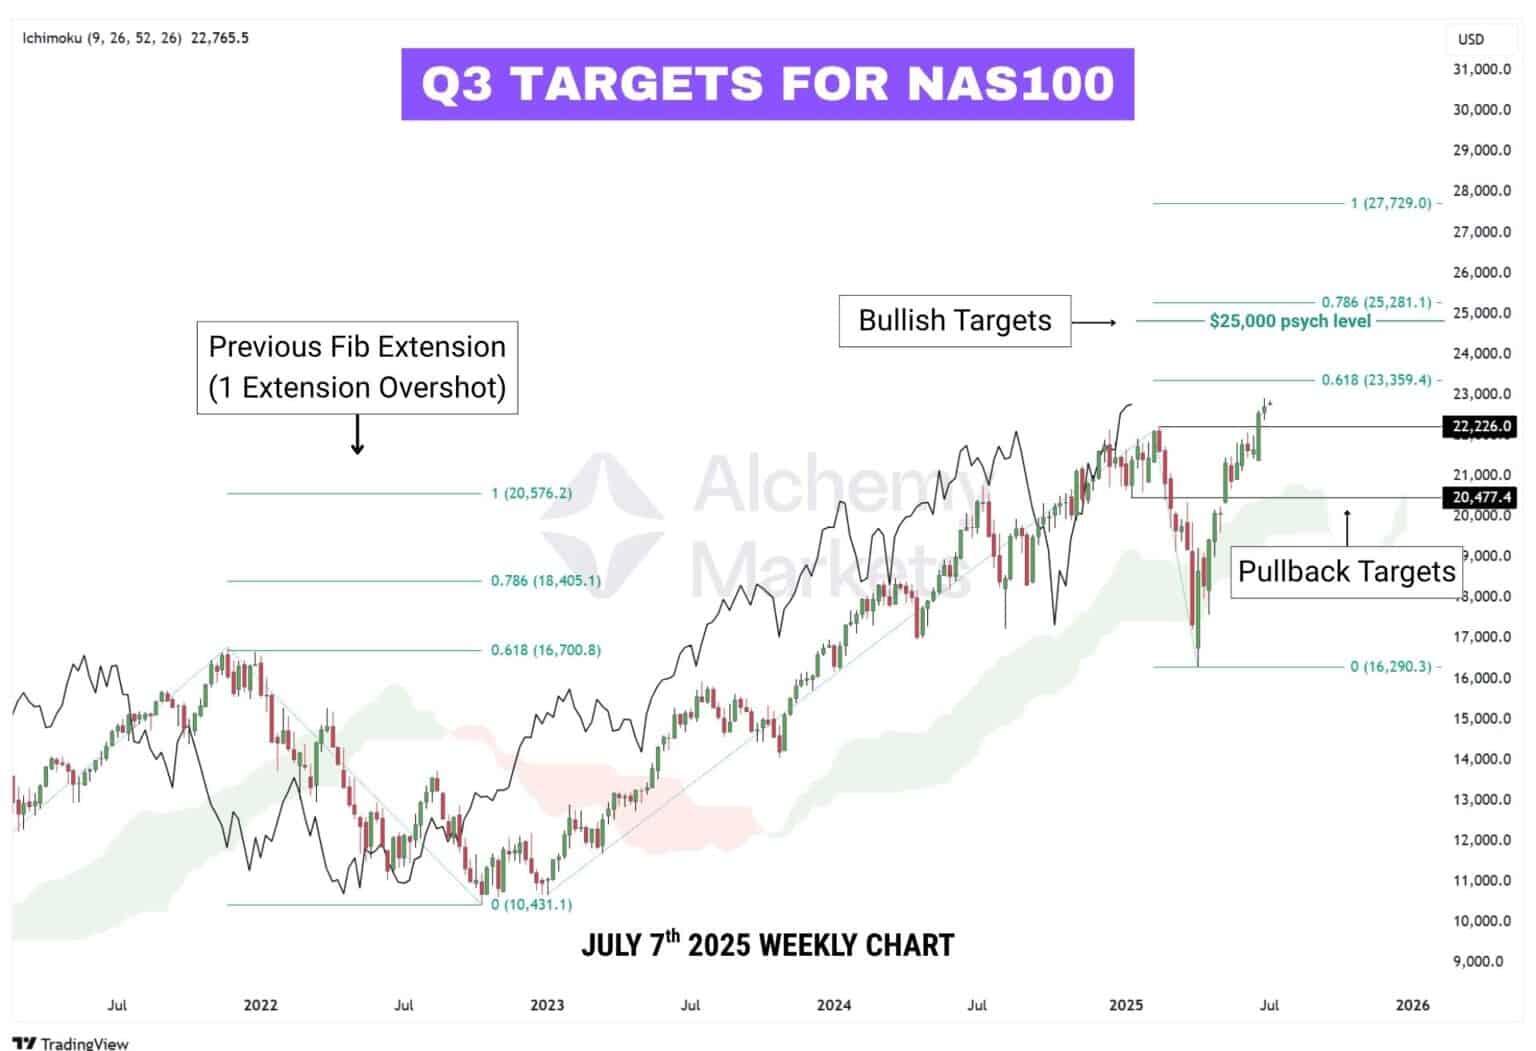
Nasdaq 100 has already overshot its previous 1.0 Fibonacci extension at $20,576, showing stronger momentum relative to other indices (much thanks to AI stocks). While the move has been impressive, pullbacks remain possible.
If we do dip, a shallow pullback zone to watch is $22,226 — this level must hold by August 2025 as per the Ichimoku lagging span. A break below that could trigger a deeper retracement toward $20,477, a key structural level just above the Ichimoku cloud and previous resistance-turned-support.
Bullish targets for Q3 are now pointing higher based on the new Fibonacci leg:
-
0.618 Extension: $23,359.
-
Psychological Milestone: $25,000.
-
0.786 Extension: $25,281.
-
1.000 Extension: $27,729.
These levels give us a roadmap for continuation, especially if macro conditions remain supportive. Given that the previous Fib extension was overshot, the path to $25K+ could accelerate quickly — but any weekly close back inside the cloud could shift the tone entirely.
Q3 targets for DJI analysis
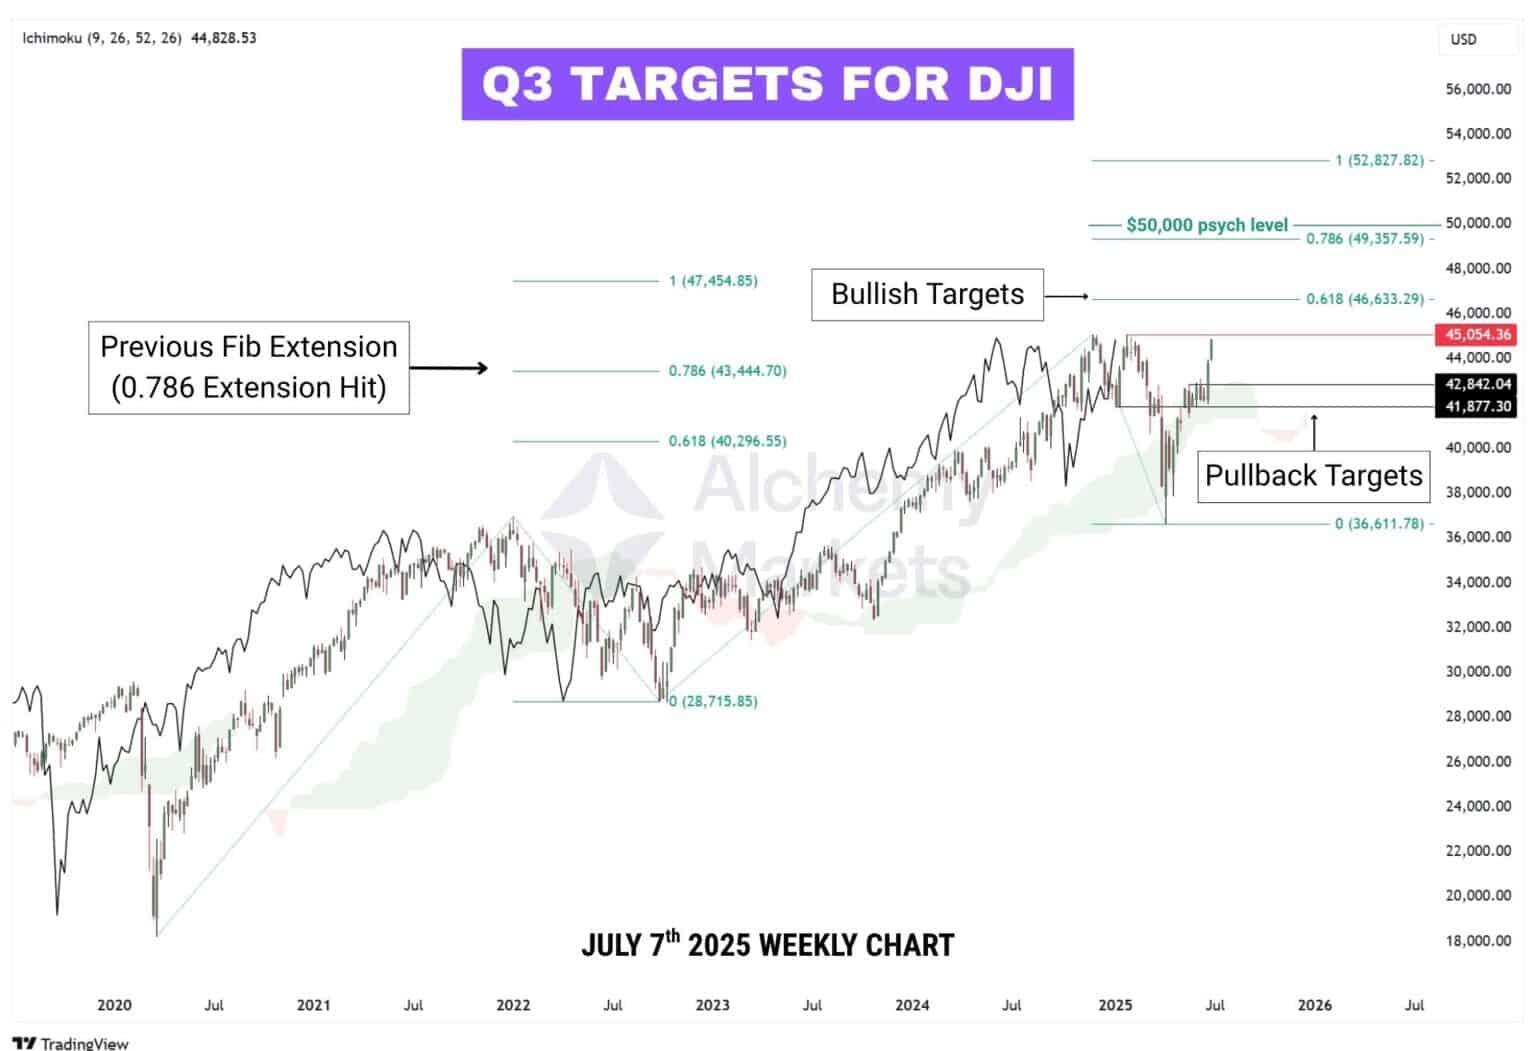
The Dow Jones has underperformed relative to SPX and NAS100, with price still sitting below its all-time high of $46,000 — a level yet to be broken. The previous move could not reach 1.000 extension, suggesting that upside momentum is more limited for now.
If we do see a pullback, key support lies in the $42,842 – $41,877 zone. This range aligns with prior consolidation and sits just above the Ichimoku cloud.
From an Elliott Wave perspective, Wave 5 targets will only become valid upon a confirmed ATH breakout. In that case, the next realistic target would be: 0.618 Extension: $46,633
Higher targets remain possible, but less probable in Q3 unless a rotation of liquidity kicks in. These include:
-
0.786 Extension: $49,357.
-
Psychological Milestone: $50,000.
-
1.000 Extension: $52,827.
With momentum still lagging, the likelihood of reaching these upper targets depends entirely on a clean and sustained break above $46,000.
Q3 targets for DAX analysis
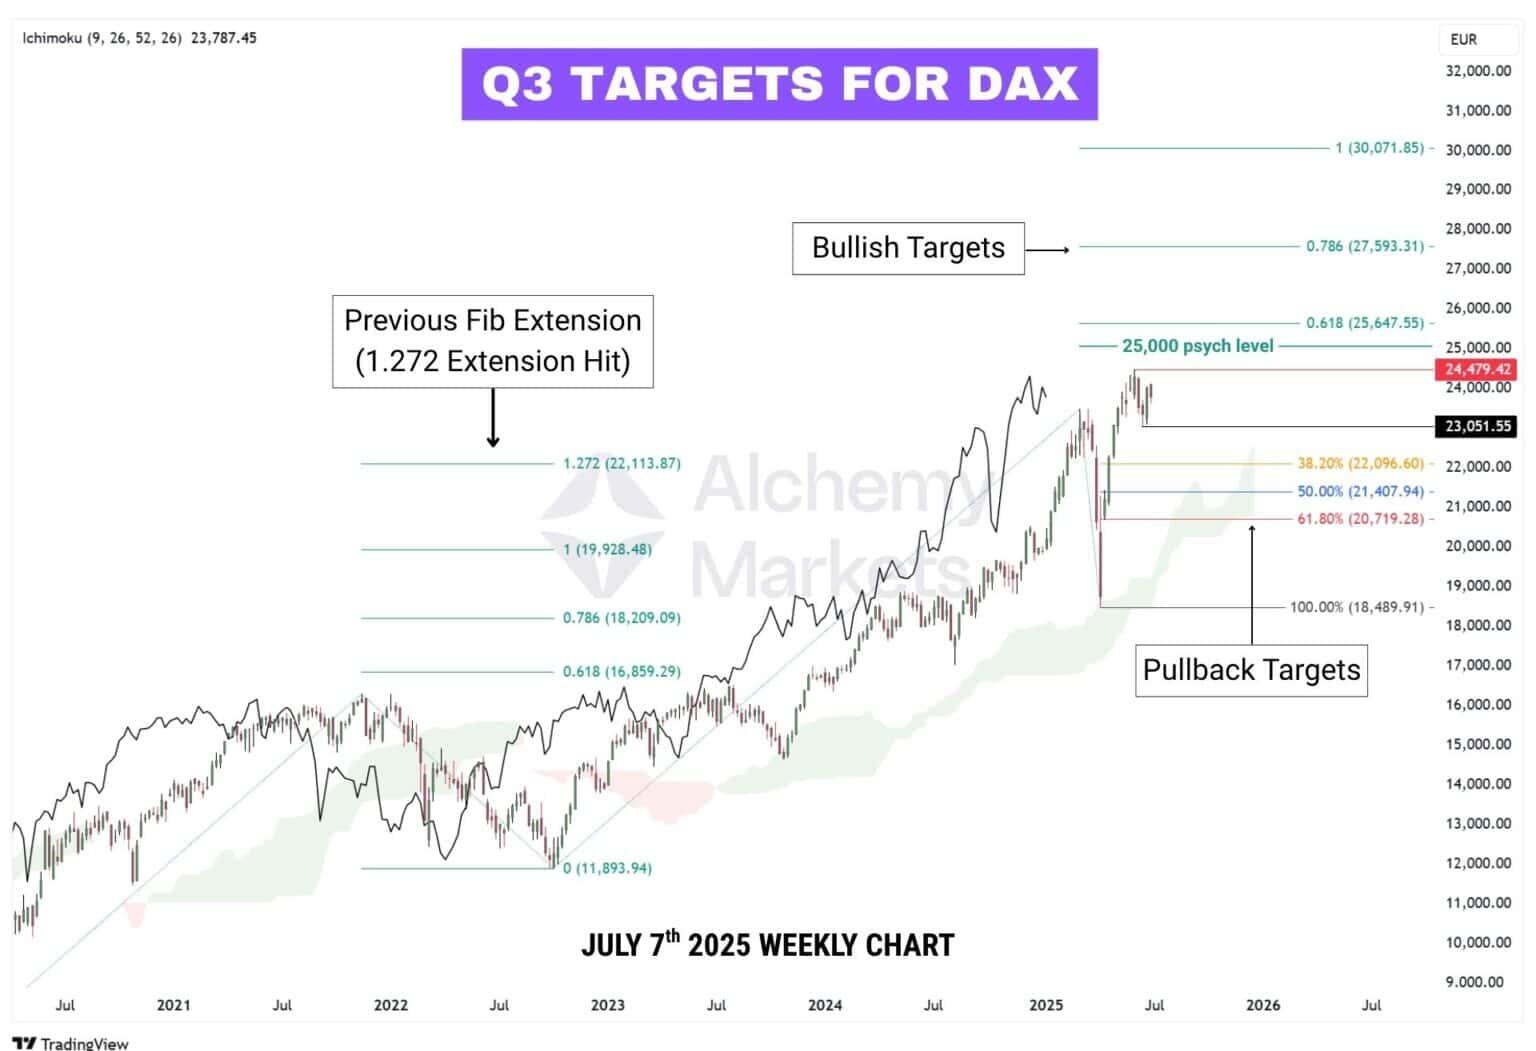
DAX remains in a strong uptrend but is currently consolidating just beneath a key resistance zone under €25,000 psychological level. A clean breakout above this confluence is needed to confirm Wave 5 continuation. Until then, this zone acts as overhead resistance.
Ichimoku’s Chikou span tells us that DAX must break its all-time high ($24,479) before the week of December 2nd, 2025 — or else the bullish structure may begin to break down. If the index stalls too long under resistance, the lagging span may fail to stay above prior price, removing trend support.
If a pullback unfolds, the first level to watch is €23,051 — a local structural low and recent weekly close. A deeper retracement could test the €21,408–€20,719 zone, supported by:
-
The Fib 50–61.8% retracement.
-
The top of the Ichimoku cloud.
-
A prior consolidation base.
If the breakout confirms, the next likely upside targets include:
-
0.786 Extension: €27,593.
-
1.000 Extension: €30,071.
A move toward €27,593 remains achievable in Q3 if bullish momentum returns. But unless that breakout occurs soon, the Chikou Line will run out of room — and the €30,000+ target may be pushed into 2026 or invalidated altogether.
Q3 targets for FTSE analysis
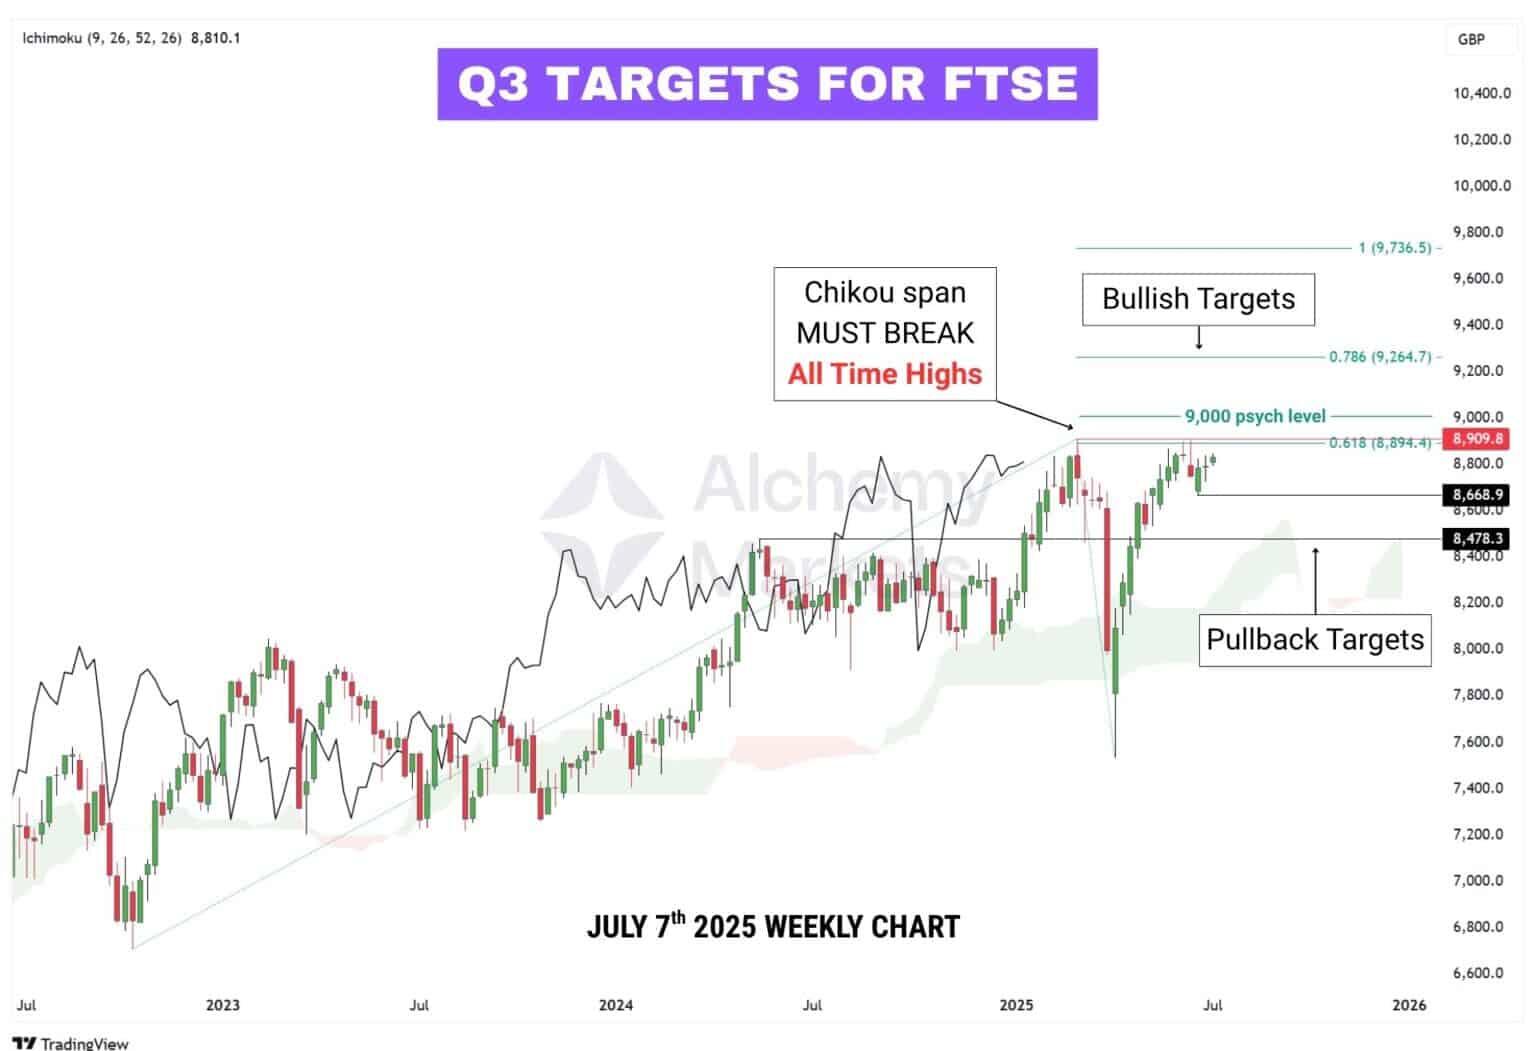
FTSE is currently pressing just below its all-time highs, with price testing the 0.618 Fibonacci extension at 8,894 and the psychological £9,000 level. Despite strong recovery, there’s still no confirmed breakout — and time is running out.
According to the Ichimoku Chikou Span (lagging line), FTSE must break above its all-time high by the week of August 25th, 2025. If this doesn’t happen, the lagging span will run into previous price action, weakening the bullish structure and reducing the probability of trend continuation.
If the breakout confirms, upside targets for Q3 include:
-
0.786 Extension: £9,264.
-
1.000 Extension: £9,736.
If momentum fades instead, key support zones to watch are:
-
£8,668: recent support level.
-
£8,478: structural base and cloud top.
A sustained close above £9,000 will likely confirm continuation, but failure to break the highs in time may stall or unwind the trend altogether.