

The upward movement of US equities seems to have been halted and market participants are waiting to see he direction of the next leg. In today’s report we are to have another look at NVIDIA’s earnings report, fundamental issues, like the Fed’s minutes, key financial releases and Trump’s intentions. Technically, we are to provide an analysis of S&P 500’s daily chart.
NVIDIA earnings today
We make a start with last week’s report by making a small reference to the release of NVIDIA’s earnings report. The EPS figure is expected to rise slightly reaching 0.893 if compared to 0.84 in February, while the revenue figure is expected to have a considerable jump, reaching $43.12B if compared to the prior release of $39.33B. Overall, should the actual figures meet or even surpass market expectations we may see NVIDIA’s share price getting some support. Yet we are also to focus on the forward guidance which is to be provided by the company and a more optimistic outlook by the company’s management could support it’s share price and vice versa. A last note, would be the high profile of the company and the attention placed by the market on semiconductors and the tech sector, thus the release could create ripple effects beyond the share’s price, affecting US stockmarkets in general.
The release of the Fed’s meeting minutes
Today we also highlight the release of the Fed’s last meeting minutes. The minutes may provide valuable insight into the inner deliberations of policymakers and could provide clues as to how to the bank may proceed in their next monetary policy meeting. Overall, should the minutes showcase a willingness by Fed policymakers to cut rates in the near future it may provide some support for US equities, as there would be increasing signals for financial conditions in the US economy to ease. On the flip side, should worries surface in regards to the state of the US economy could weigh on US stock markets, despite possibly implying an earlier rate cut. Also should there be signals that the bank is ready to remain on hold for longer, we may see US stockmarkets losing ground. Please note that currently, Fed Funds Futures imply that the market expects the bank to cut rates twice until the end of the year.
Financial releases of interest for equity traders
Over the coming days there are two financial releases stemming from the US that could affect US Equities. The one would the release of the revised US GPD rate for Q1 25 tomorrow. Should we see the rate slowing down we may see market worries for the US economic outlook being enhanced thus weighing possibly on US equities, given the markets worries intensification after the downgrading of the US Government’s rating by Moody’s. On the flip side a possible acceleration of the GDP rate could support US equities as market worries may ease. Also on Friday we note the release of the PCE rates for April, core and headline, which is also the Fed’s favourite inflation metric. Should the release imply a relative persistence of inflationary pressures in the US economy, we may see the release weighing on US stock markets as it may provoke a more hawkish stance on behalf of the Fed.
Trump’s tariff intentions
We note the recent rollercoaster, with Trump’s intentions of imposing another 50% tariffs on European products entering US soil being announced on Friday and postponed for the 9th of July on Monday. The Europeans seem to be preparing for negotiations European Union officials have asked the EU’s leading companies and CEOs for details of their U.S. investment plans, as reported by Reuters. Putting aside, Trump’s claims for victory over the EU, the US side seems to be noting progress on the issue. Should there be further signals for a thawing of the tensions in the US-EU relationships we may see support building up for US stockmarkets and vice versa.
Technical analysis
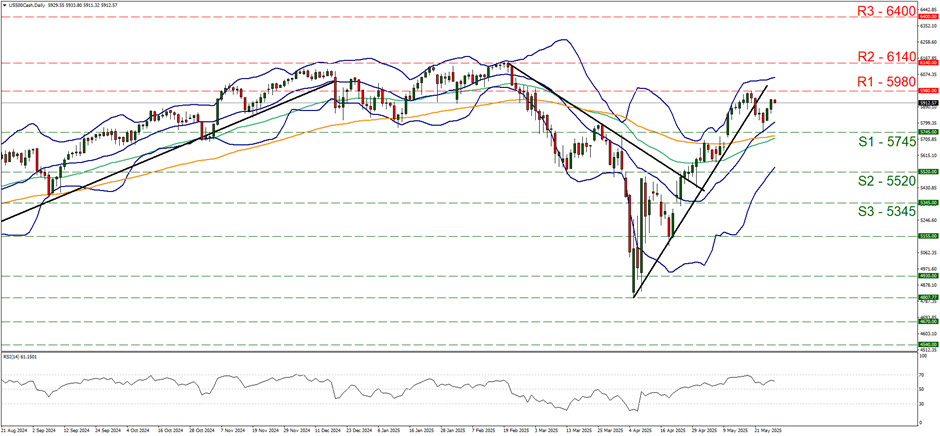
US500 daily chart
-
Support: 5745 (S1), 5520 (S2), 5345 (S3).
-
Resistance: 5980 (R1), 6140 (R2), 6400 (R3).
S&P 500 edged higher since the start of the week, yet has remained well within the boundaries set by the 5980 (R1) resistance line and the 5745 (S1) support level. Given that on the 21st of May, the price action of the index has broken the upward trendline guiding it since the 7th of April and has remained in the prementioned levels, we maintain a bias for a sideways motion of the index at the current stage. Yet we also note that the RSI indicator tends to remain between the readings of 50 and 70, while the Bollinger bands are still pointing upwards, with both indicators implying a bullish predisposition of the market for the index. Yet for a bullish outlook to emerge, we would require the price action of the index to break the 5980 (R1) resistance line and start aiming for the 6140 (R2) resistance level, a level that marks an All Time High level. On the flip side, for a bearish outlook we would require a clear break below the 5745 (S1) support line with the next possible target for the bears being the 5520 (S2) support base.