

Overall since our last report, US stock markets seem to timidly be on the rise which could be implying that some slight optimism may have started to emerge among market participants. Today we are to discuss the latest developments regarding, the US-Sino trade war, have a look on its consequences on specific companies and also have a preview of high impact financial releases due out in the next few days that could impact US stock markets. For a rounder view we are to provide a technical analysis of S&P’s 500 daily chart.
Latest developments in Trump’s trade war
US President Trump yesterday signed orders for an easing of his auto tariffs. The easing consists in the offsetting of tariffs for auto parts produced elsewhere and imported to the US by 3.75% of the value of the Manufacturer’s Suggested Retail Price to end of April 2026 and 2.5% by end of April 2027. Despite the relief giving the impression of some easing of trade tensions, practically the US President is providing US automakers with some leeway to adjust to the new norms. The heart of US President Trump’s trade policies remains intact. On another sign of easing of trade tensions, US Commerce Secretary Lutnick stated that the US has reached its first trade deal and is waiting for approvals from the counterpart country before announcing it. Such a trade deal may be considered an encouraging sign, yet more trade deals are required to generate the sense that it’s a matter of time before the tensions materially ease. On the flip side, China’s rhetoric remains hawkish, with consistent statements from Chinese officials and Chinese leader Xi Jinping, that China will not back down, while at the same time calls upon other nations to resist the bullying of the US. It should be noted that China’s manufacturing PMI figures for April dropped implying that Chinese factories may be struggling. In a latest development China is reported to have created a list of U.S.-made products that would be exempted from China’s 125% tariffs, which tends to suggest an easing of tensions. In the big picture any further escalating of the trade war could reverse the positive market sentiment that has started to emerge and thus weigh on US equity markets, while any further easing could support US stock markets.
Amazon and VW reaching the headlines
Volkswagen one of the largest automakers worldwide, announced today that profit margins are likely to be to the lower end of its 5.5-6.5% forward guidance, citing that the instability of international trading conditions given US resident Trump’s trade wars make any forecast as practically impossible. It should be noted that other car makers have made similar statements highlighting the uncertainty for their outlook, which turn may weigh on the sector as a whole. On a retail level, we highlight the reported plans of Amazon to display separately the cost of the US President’s tariffs, a move that caused the anger of the US President. It’s characteristic that White House press secretary Leavitt characterised the move as “a hostile and political act by Amazon”. The company quickly denied any such plans by stating that “The team that runs our ultra low cost Amazon Haul store considered the idea of listing import charges on certain products. This was never approved and is not going to happen“. It should be noted that the two sides have now made up with Trump saying that Bezos is a “good guy” but the issue highlighted that company seems to be closely watched by the US administration and the overall situation remains tense, hence any similar escalation could spell trouble for Amazon and its share price.
April’s US employment report may shake the markets
Last but not least, we would like to point out some financial releases which in turn could move the markets. We make a start in today’s early American session, as the US GDP advance rate for Q1 is to be released and is expected to slow down considerably and should the actual rate be even lower, we may see the release weighing on US stock markets. On Friday we highlight the release of the US employment report for April with its NFP figure and the unemployment rate. Should the rates and figures imply a tighter than expected US employment market, we may see the release weighing on US equities while further cooling of the US employment market may provide support for US stock markets as the market’s expectations for the Fed to continue with extensive monetary policy easing could be enhanced.
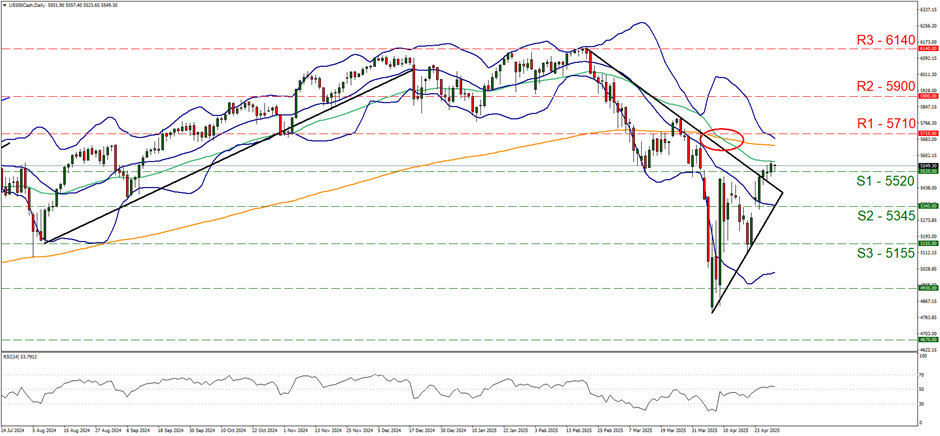
Technical analysis
US500 daily chart
-
Support: 5520 (S1), 5345 (S2), 5155 (S3).
-
Resistance: 5710 (R1), 5710 (R2), 5900 (R3).
On a technical level, we note the consistency in the rise of the index’s price action since our last report, as S&P 500 broke the 5520 (S1) resistance line, now turned to support. We note that the index’s price action was able to escape the symmetrical triangle being formed by breaking the downward trendline incepted since the 20th of February which tends to highlight the bullish prospective for the index’s price action. Yet despite the bullish signal the RSI indicator tends to note an only marginal rise, remaining just above the reading of 50, implying a relative indecisiveness on behalf of market participants about S&P’s future direction. Should the bulls continue to lead the index’s price action we may see S&P 500 reaching if not breaching the 5710 (R1) resistance level, with the next target for the bulls being possibly at the 5900 (R2) resistance level. A bearish scenario currently seems remote yet is still possible and for its adoption we would require the index’s price action drop, breaking clearly the 5520 (S1) support line and continue to break also the 5345 (S2) support level, while even lower we note the 5155 (S3) support base.