


Summary
- This note covers key statistics for the U.S. corporate bond market as of August 7, 2024.
- Wednesday trading volume was 47 percent above normal.
- 80 percent of senior fixed-rate bonds showed price declines for the day.
- 55 percent of losses were due only to Treasury yield changes.
- The performance attribution analysis parses price changes into changes due only to Treasury yield changes, changes due to credit and liquidity factors, and changes due to both factors.
- For investment strategies consistent with this post, please see our investment group The Corporate Bond Investor on SeekingAlpha.
Analysis of Reasons for Today’s Bond Price Changes
From Kamakura’s KRIS® service, we summarize the bond price changes and their causes for the senior fixed-rate bonds with at least $1 million in volume for the day:

Now we turn to the 20 most heavily traded corporate bonds and explain the reasons for their price changes in this chart:

These price changes are due to changes in U.S. Treasury yields (the “risk-free yield curve”), the credit quality of the issuer, liquidity risk for each bond, and the bond call price for each bond. If we separate the reasons for the bond price changes into “changes due to rates” and “changes due to credit, liquidity and call risk,” we can focus on the bonds with the largest positive changes in credit. The top 20 credit-related gains component of bond price changes are shown here:

For the bonds above, the change due to credit, liquidity, and call risk was positive, increasing the value of the bonds.
The top 20 credit-related loss components of bond price changes are shown here:
For the bonds above, the change due to credit, liquidity, and call risk was negative, decreasing the value of the bonds.
Finally, we measure the impact of a change in U.S. Treasury yields on bond prices. The most affected bonds generally have long maturities, as shown here:

Long-Term Default Outlook for Rated Public Firms
The Expected Cumulative Default Rate from SAS Institute Inc., the only daily index of #credit quality of rated firms worldwide, shows the 1-year rate up 0.01% at 0.63% & 10-year up 0.01% at 8.11%.
Kamakura Troubled Company Index
The KRIS Troubled Company Index shows daily worldwide corporate credit conditions were up 1 point at the 69th percentile, 1990 to 2024, with 100 indicating best conditions.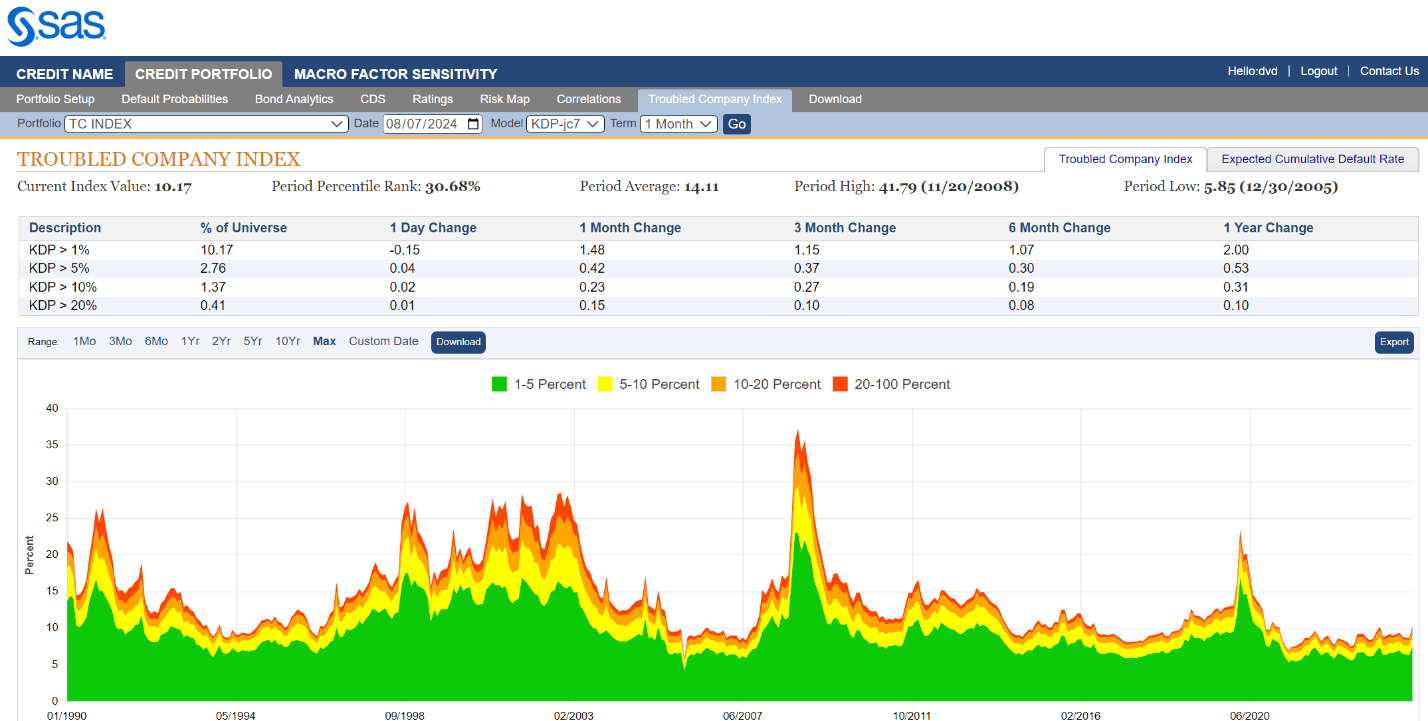
Do Legacy Credit Ratings Have Any Value?
Credit ratings were invented in 1860, the same year as the famed Pony Express. Like the Pony Express, the basic business model of legacy credit ratings has become outmoded. In another daily blog post, we explain why ratings have fallen out of favor and why they have been replaced by modern KRIS default probabilities. The low correlation between legacy ratings and state-of-the-art KRIS default probabilities is also updated daily.
For More Information
Here is a helpful guide to other resources on SeekingAlpha:
https://subscriptions.seekingalpha.com/lp_premium_beat_the_market_4/?source=affiliate:420043
For near-real time credit and risk management updates from Kamakura Corporation, please follow
https://www.linkedin.com/in/donald-van-deventer-5938b76/
www.twitter.com/SASSoftware
Updates are posted at least every three hours, and more often (every 30 minutes) when market conditions are highly volatile.
For technical research papers, please see
https://www.researchgate.net/profile/Robert_Jarrow
https://www.researchgate.net/profile/Donald_Van_Deventer
www.sas.com