

The markets are relatively calm today, but don’t let that fool you. They are about to move.
There are multiple clues as for the way in which the markets are likely to move next, and I’m going to discuss three of them in today’s analysis.
One of them is about the USD Index, the other is about bitcoin, and the final one is about the analogy in the gold stocks to gold ratio. Let’s start with the former.

I previously elaborated on how the previous lows were likely to stop the USD Index’s decline, and that’s what happened. Despite the initial move below the 2023 low, the USD Index moved back up, forming a strong weekly reversal, which is a bullish signal of medium-term importance.
The thing that I’d like to add today is that from a very short-term point of view, we also see that the USD Index is about to rally.
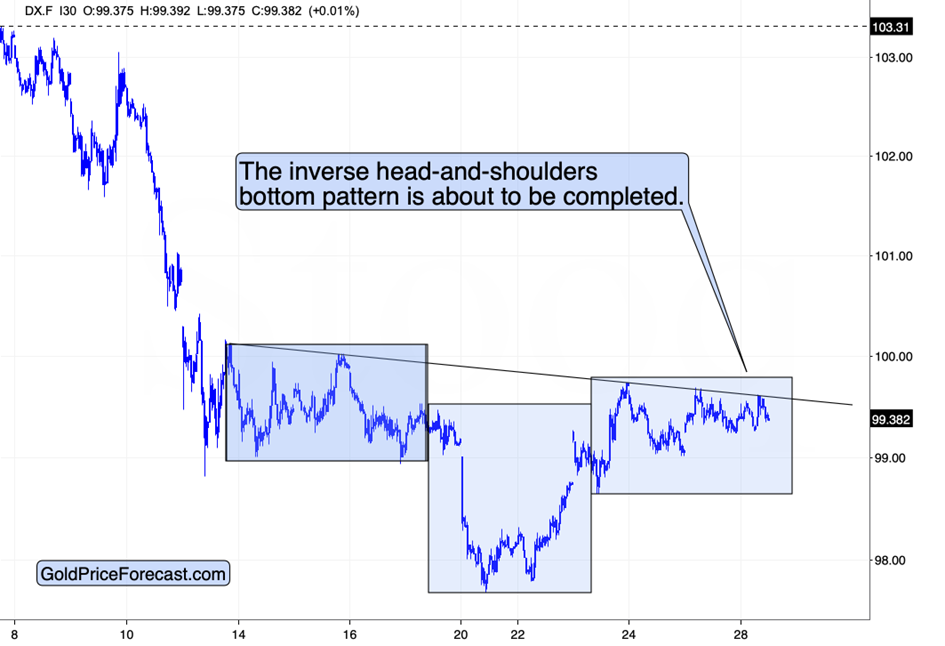
The above chart features the 30-minute candlesticks, and based on them, it’s clear that the USD Index has been forming an inverse head-and-shoulders bottom pattern for two weeks now.
As the trading becomes narrower, it seems that we’re about to get a breakout any hour now.
This pattern alone should be enough to trigger a rally to at least 101.5.
This, in turn, would confirm the bottom from the long-term point of view and likely lead to further gains in the following weeks. The opposite would be likely in commodities and in the precious metals sector.
Bitcoin patterns mirror 2022: A warning
Now, as far as Bitcoin is concerned, I’d like to point your attention to a specific analogy between now and 2022.
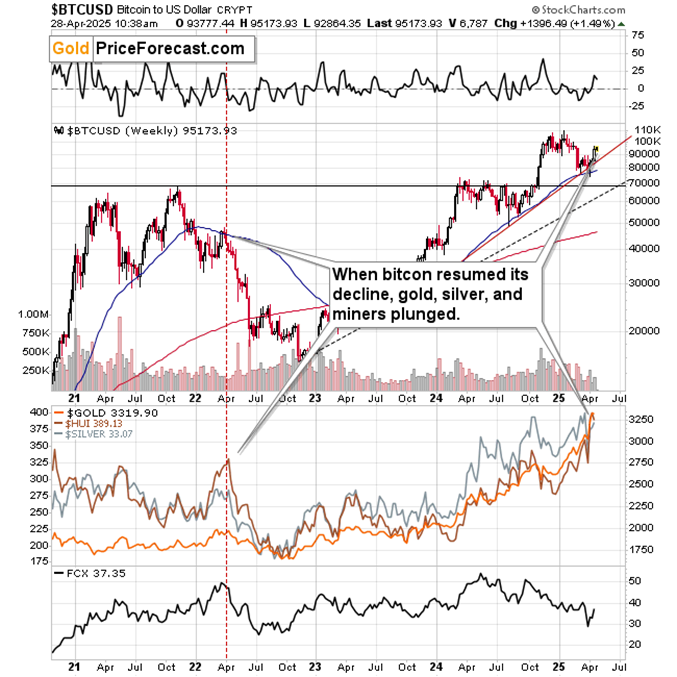
Price patterns in bitcoin and the way gold, silver, and mining stocks reacted are very similar in both cases.
Bitcoin formed its final top, declined, and corrected in both cases with more or less the same price action in the precious metals sector. Namely, bitcoin’s initial decline and the correction triggered rallies in the PMs and miners. Perhaps the investors that sold bitcoin initially simply switched to the other sector instead of holding cash. That would make sense, as both are viewed as anti-dollar assets.
Still, after the corrective upswing was over, both: bitcoin and precious metals declined together. This is likely where we are right now – on the verge of that decline. And yes, even the time of the year is almost identical.
On the bottom of the above chart, you can see what happened to the price of FCX, my top shorting candidate – it collapsed and was cut in half in just a few months. It looks like we might reap profits on it once again.
So, we are very well positioned even in light of the analogy to the crypto market.
Finally, let’s take a look at the gold stocks (HUI Index) to gold ratio.
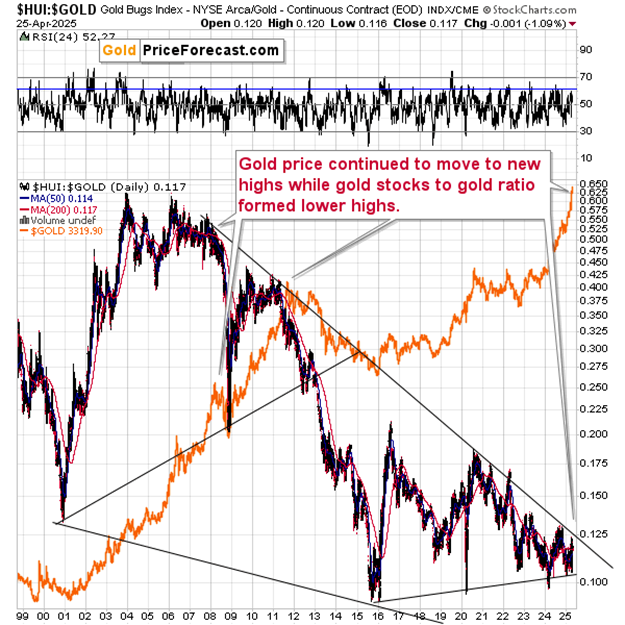
Gold miners’ revenue and, therefore profits depend on gold prices. There are also other considerations and cost factors, but in general, the higher the gold price, the better profits for miners should be – and thus, their shares should trade higher.
The problem is that this isn’t really the case. Gold stocks were outperforming gold between 2000 and 2004, and then they stopped until 2008. From that point onwards they have been either underperforming gold on a medium-term basis (between 2008 and early 2016) or not doing much (between 2016 and now).
Many people have been calling this to be a massive buying opportunity, but until we see a breakout above the declining long-term resistance line, this is simply NOT the case.
Ok, one – great – alternative scenario would be that we’d see a big decline in the entire precious metals sector, especially in the mining stocks. This would create a massive buying opportunity in the miners, which tend to perform particularly well in the first part of the rally – we saw that in early 2016. In fact, this is exactly what we are likely to see in the following months.
Want free follow-ups to the above article and details not available to 99%+ investors? Sign up to our free newsletter today!