

- Gold price struggles to build on the overnight move up, though the downside seems limited.
- A modest USD bounce from a multi-month low and a positive risk tone cap the precious metal.
- Trade war fears and Fed rate cut bets support the XAU/USD pair ahead of the US CPI report.
Gold price (XAU/USD) extends its sideways consolidative price move near the weekly top during the early European session on Wednesday as traders remain on the sidelines ahead of the US consumer inflation figures. The crucial US Consumer Price Index (CPI) will be looked upon for fresh cues about the Federal Reserve’s (Fed) rate-cut path, which, in turn, will drive the US Dollar (USD) demand and provide a fresh directional impetus to the non-yielding yellow metal.
Some repositioning trade ahead of the key data risk assists the USD in gaining some positive traction and reversing a part of the overnight losses to its lowest level since October 16. This, along with a positive turnaround across the global equity markets, acts as a headwind for the Gold price. However, worries about US President Donald Trump’s trade tariffs, a global trade war and its impact on the world economy, and Fed rate cut bets continue to support to the safe-haven bullion.
Daily Digest Market Movers: Gold price lacks firm direction as traders await US CPI for Fed rate-cut cues
- US President Donald Trump upped the ante in a trade war and said on Tuesday that he would double planned tariff increases on steel and aluminum coming from Canada to 50%, providing a strong boost to the safe-haven Gold price. Trump, however, reversed course in response to Ontario Premier Doug Ford’s announcement to suspend a 25% surcharge on electricity sold to the US.
- The lower house of Congress narrowly passed a Republican spending bill that would avoid a government shutdown on March 14 and keep the US government open until September, further boosting investors’ confidence. The bill now heads to the Senate and will need the support of at least seven Democrats to overcome the 60-vote filibuster threshold before sending it to Trump for his signature.
- Ukraine expressed readiness to accept the US proposal for an immediate, interim 30-day ceasefire with Russia after bilateral talks in Jeddah, Saudi Arabia. The US would now take the offer to Russia, which has not yet responded to the proposal. The development, however, remains supportive of a turnaround in the global risk sentiment and might act as a headwind for the precious metal.
- Over the weekend, Trump declined to rule out the possibility of a recession in the US and flagged some economic turbulence on the back of his policy agenda. This, along with signs of a cooling US labor market, continues to fuel speculations that the Federal Reserve would soon resume its rate-cutting cycle. In fact, traders are pricing in three rate cuts of 25 basis points each by the end of this year.
- This might keep a lid on any meaningful US Dollar recovery from its lowest level since mid-October touched on Tuesday and favors the XAU/USD bulls. Traders, however, might opt to wait on the sidelines and look forward to the crucial US Consumer Price Index (CPI) report, which might influence the Fed’s rate-cut path and provide some meaningful impetus to the non-yielding yellow metal.
Gold price bulls need to wait for a sustained strength beyond the $2,928-2,930 hurdle before placing fresh bets
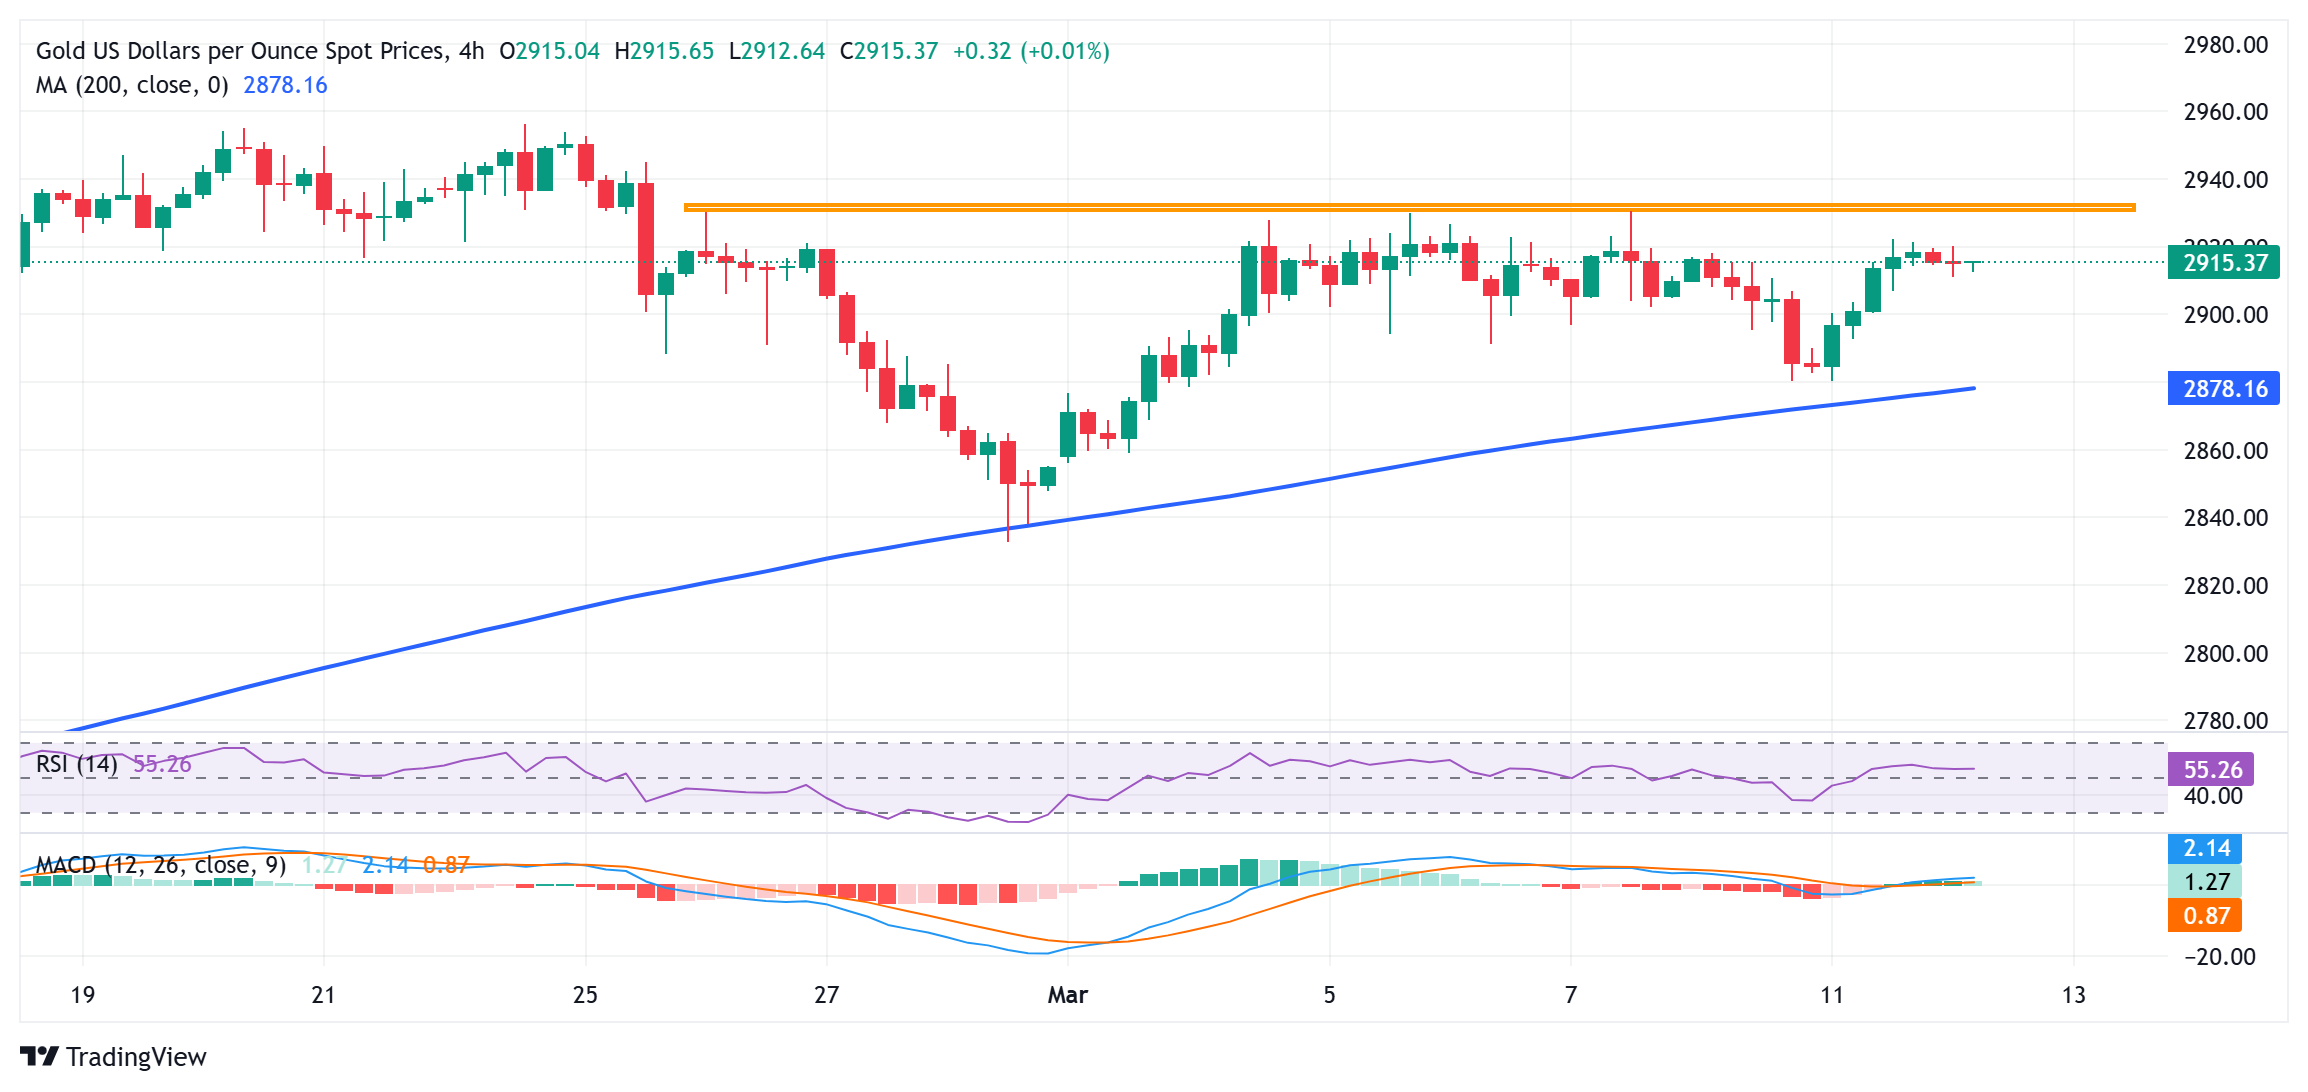
From a technical perspective, bulls might need to wait for a move beyond the $2,928-2,930 hurdle before positioning for further gains. The subsequent move up has the potential to lift the Gold price back towards the all-time peak, around the $2,956 area touched on February 24. Some follow-through buying will be seen as a fresh trigger for bulls and pave the way for the resumption of the recent well-established uptrend amid still positive oscillators on the daily chart.
On the flip side, weakness below the $2,900 mark might now find some support near the $2,880 region, or the weekly low. This is followed by the $2,860 region, below which the Gold price could accelerate the slide towards the late February swing low, around the $2,833-2,832 region, before eventually dropping to the $2,800 mark.
US Dollar PRICE Today
The table below shows the percentage change of US Dollar (USD) against listed major currencies today. US Dollar was the strongest against the Japanese Yen.
| USD | EUR | GBP | JPY | CAD | AUD | NZD | CHF | |
|---|---|---|---|---|---|---|---|---|
| USD | 0.17% | 0.17% | 0.45% | 0.19% | 0.17% | 0.14% | -0.03% | |
| EUR | -0.17% | -0.01% | 0.28% | 0.02% | -0.01% | -0.02% | -0.20% | |
| GBP | -0.17% | 0.00% | 0.29% | 0.03% | -0.00% | -0.02% | -0.19% | |
| JPY | -0.45% | -0.28% | -0.29% | -0.26% | -0.28% | -0.31% | -0.46% | |
| CAD | -0.19% | -0.02% | -0.03% | 0.26% | -0.02% | -0.05% | -0.21% | |
| AUD | -0.17% | 0.01% | 0.00% | 0.28% | 0.02% | -0.02% | -0.18% | |
| NZD | -0.14% | 0.02% | 0.02% | 0.31% | 0.05% | 0.02% | -0.16% | |
| CHF | 0.03% | 0.20% | 0.19% | 0.46% | 0.21% | 0.18% | 0.16% |
The heat map shows percentage changes of major currencies against each other. The base currency is picked from the left column, while the quote currency is picked from the top row. For example, if you pick the US Dollar from the left column and move along the horizontal line to the Japanese Yen, the percentage change displayed in the box will represent USD (base)/JPY (quote).