

Six months after the UK’s new transparency regime went live, and three months after the EU’s revised bond regime came into effect, we can see a clear shift in the data. More bond trading is being published sooner, more volume has moved out of the longest deferral buckets, and more post-trade information is available to the market.
The launch of the UK bond Consolidated Tape will test whether more visible and aggregated data can become more usable data.
The direction of travel is clear: across both regimes, a greater share of bond trading is now visible in real time or close to real time.
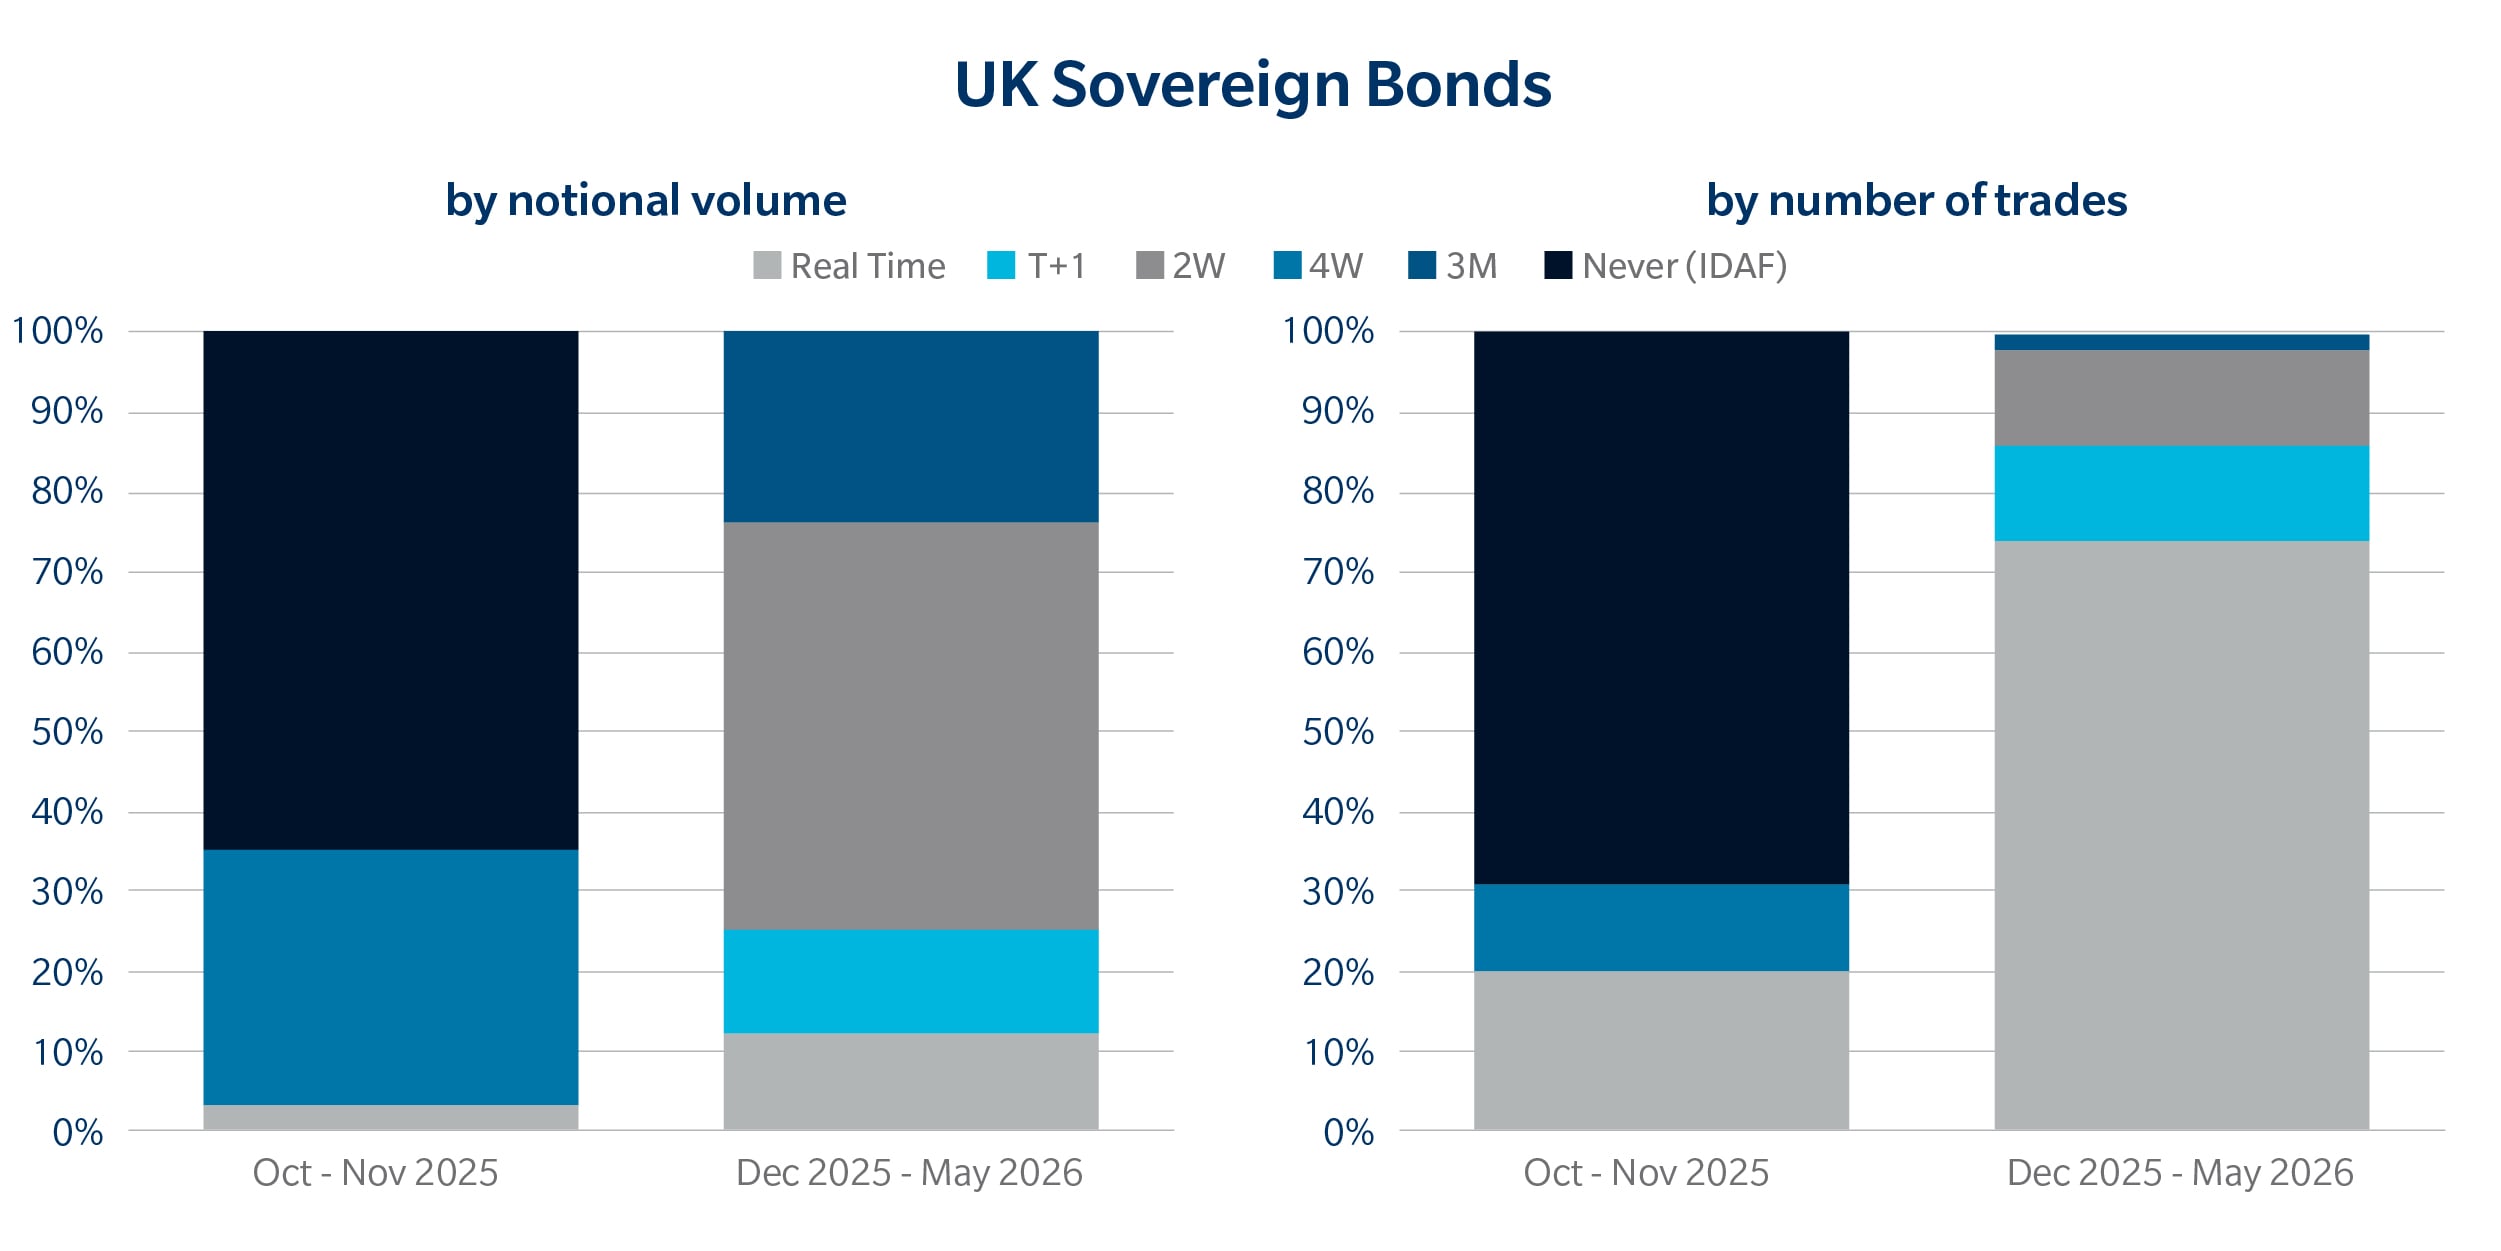
UK Sovereign. UK sovereign bond publication timing.
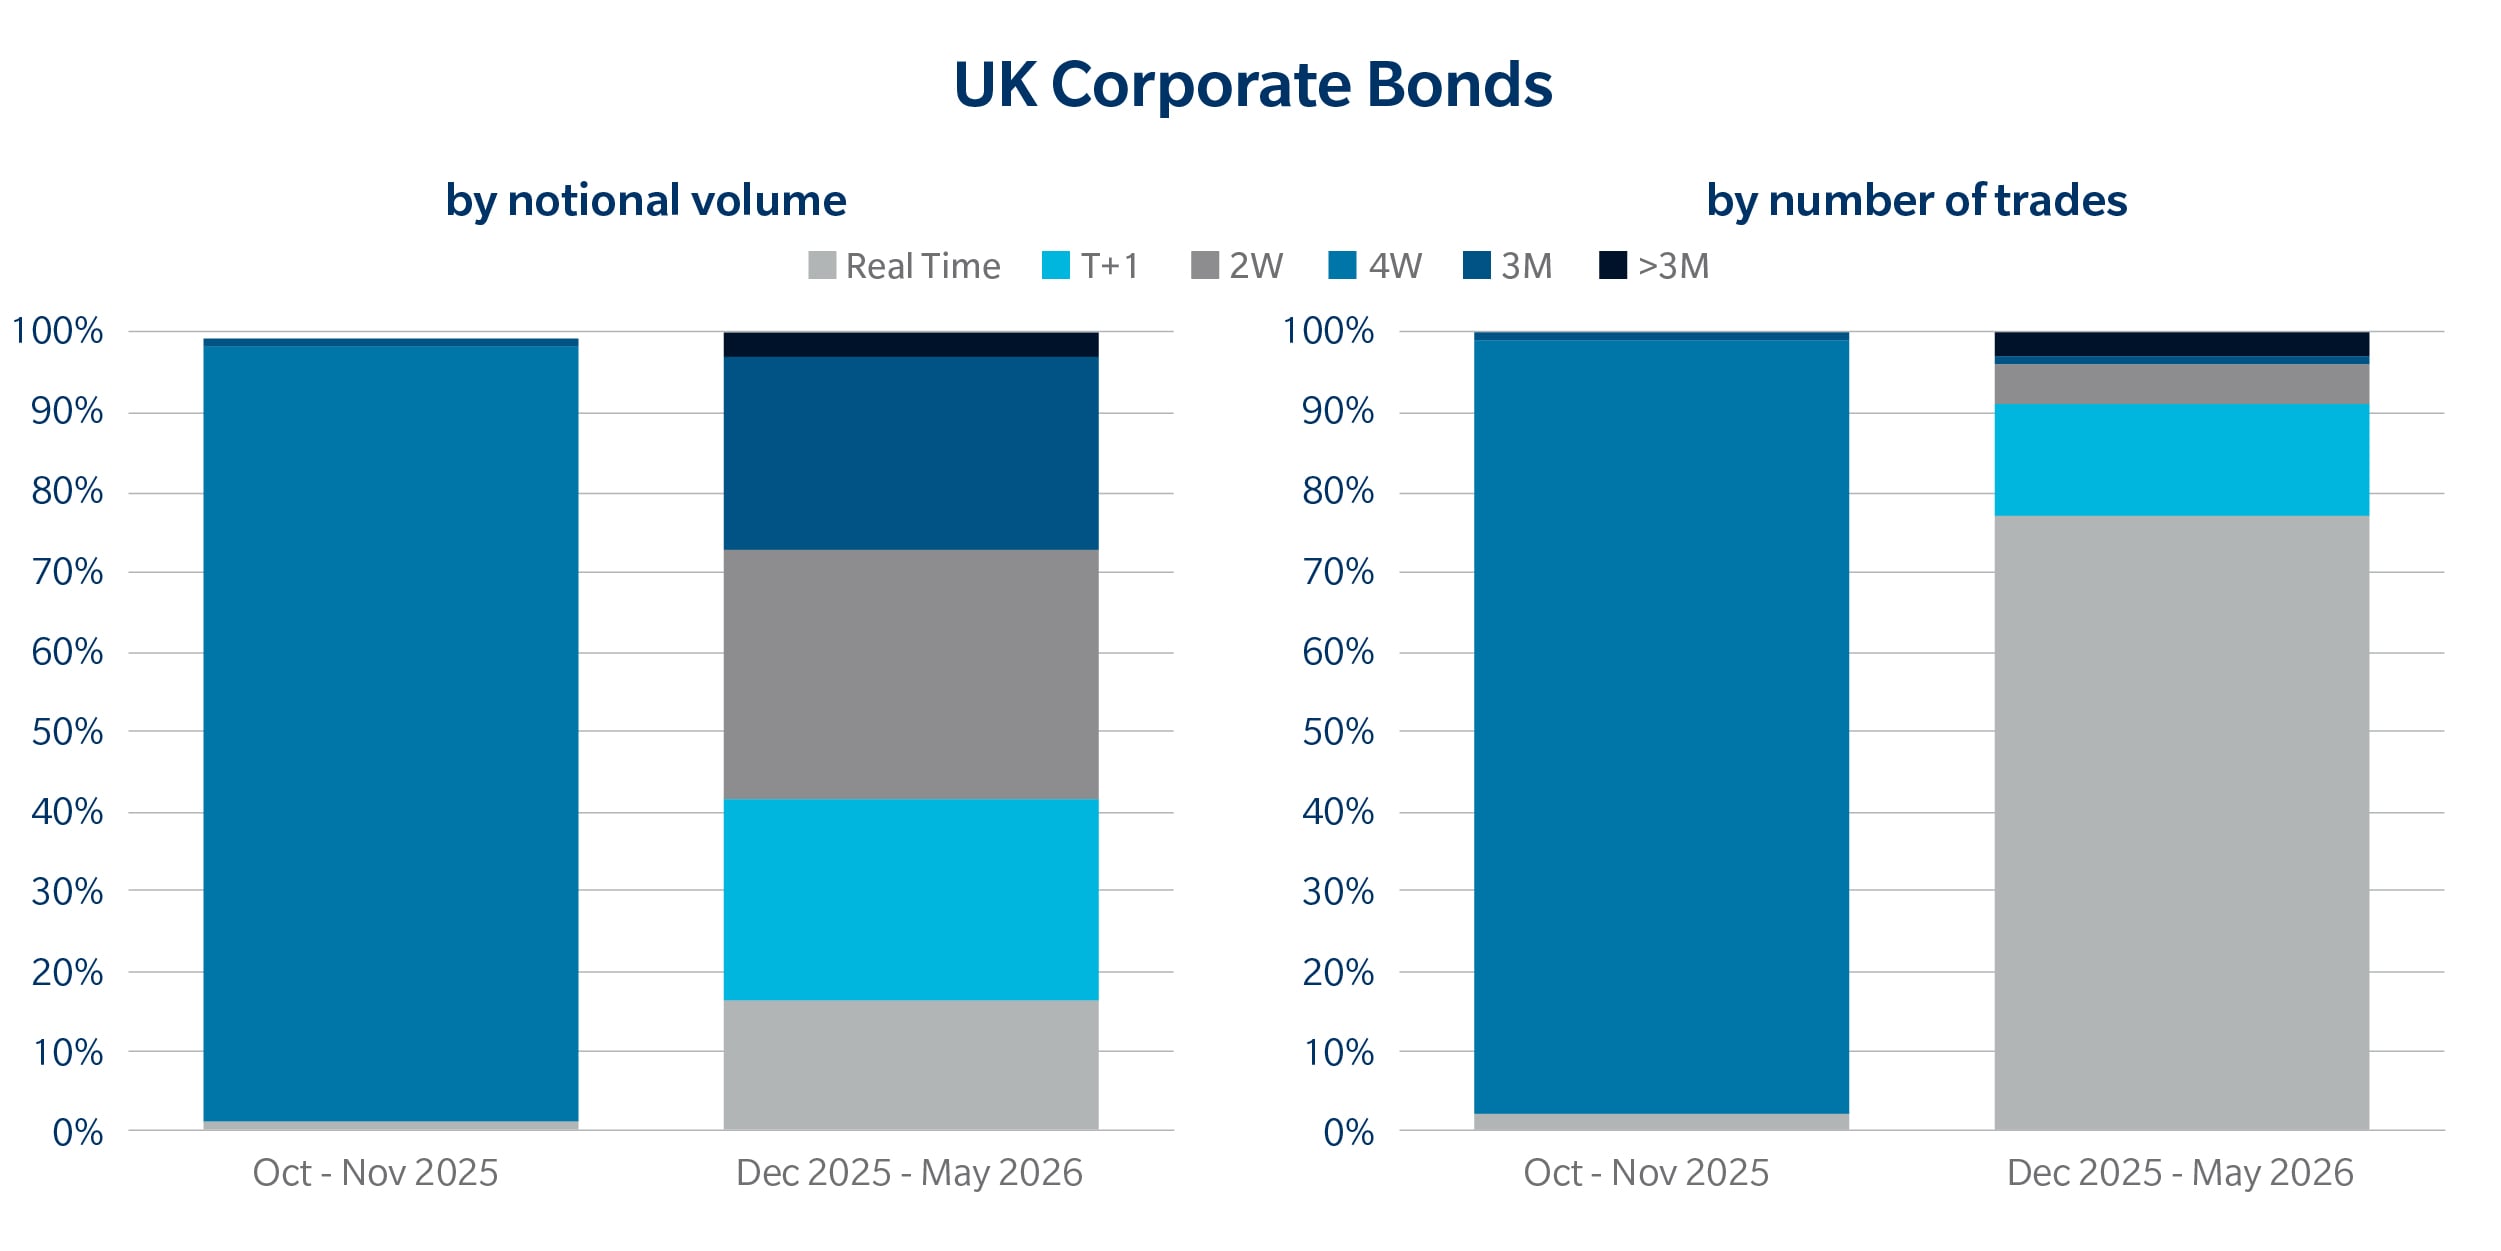
UK Corporate. UK corporate bond publication timing.
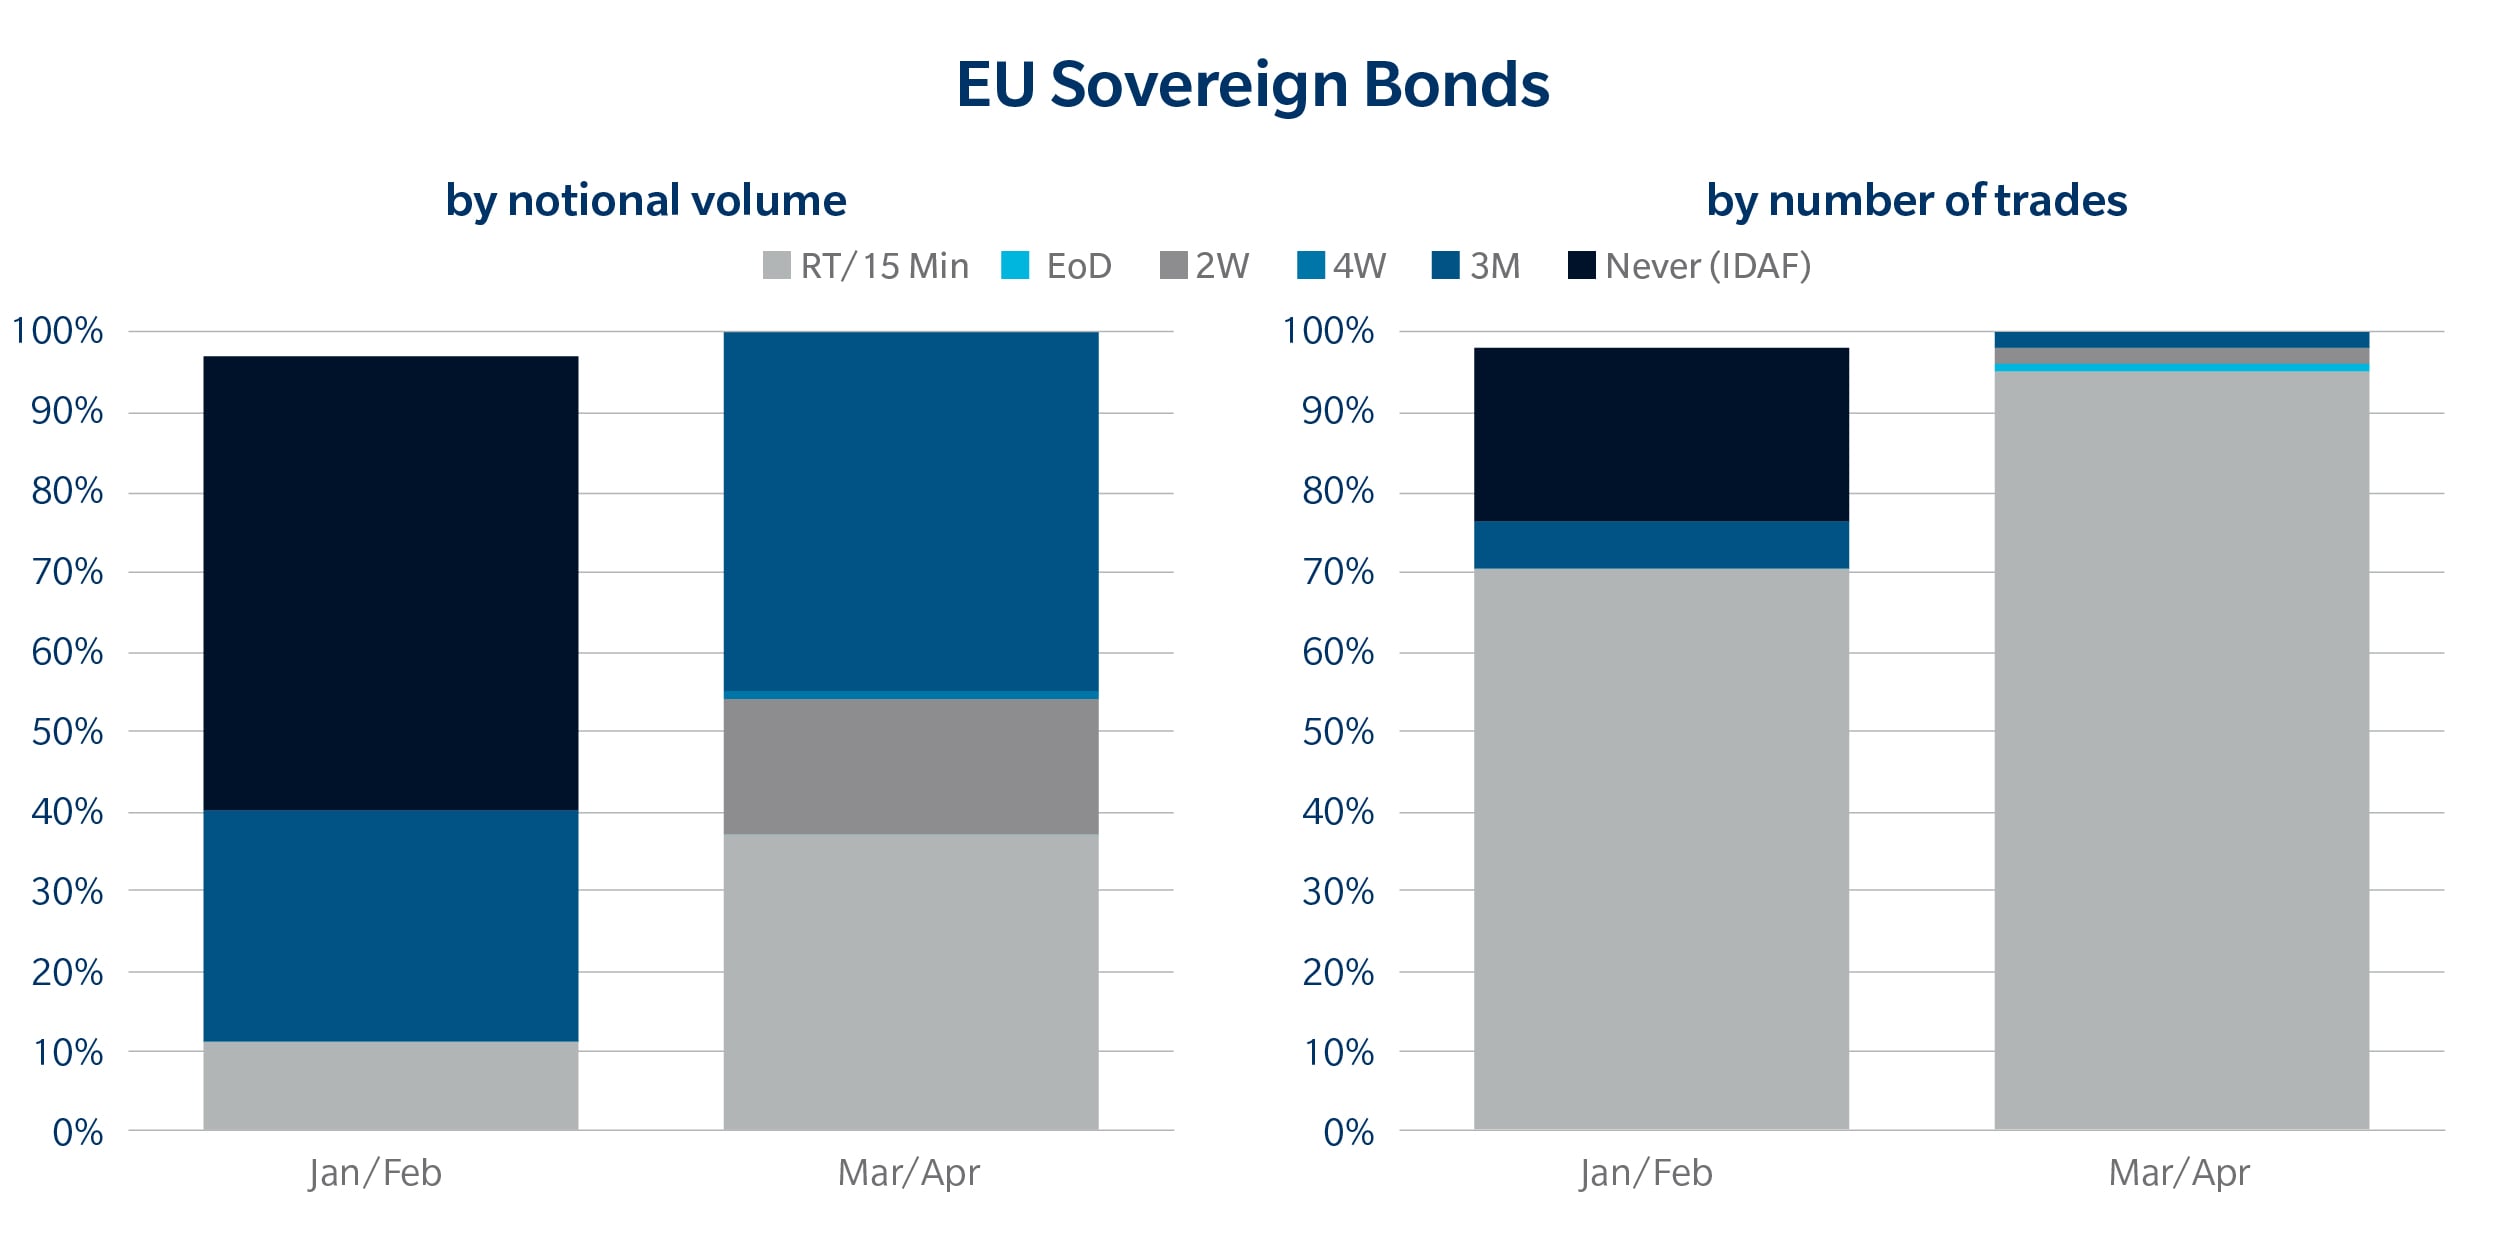
EU Sovereign. EU sovereign bond publication timing.
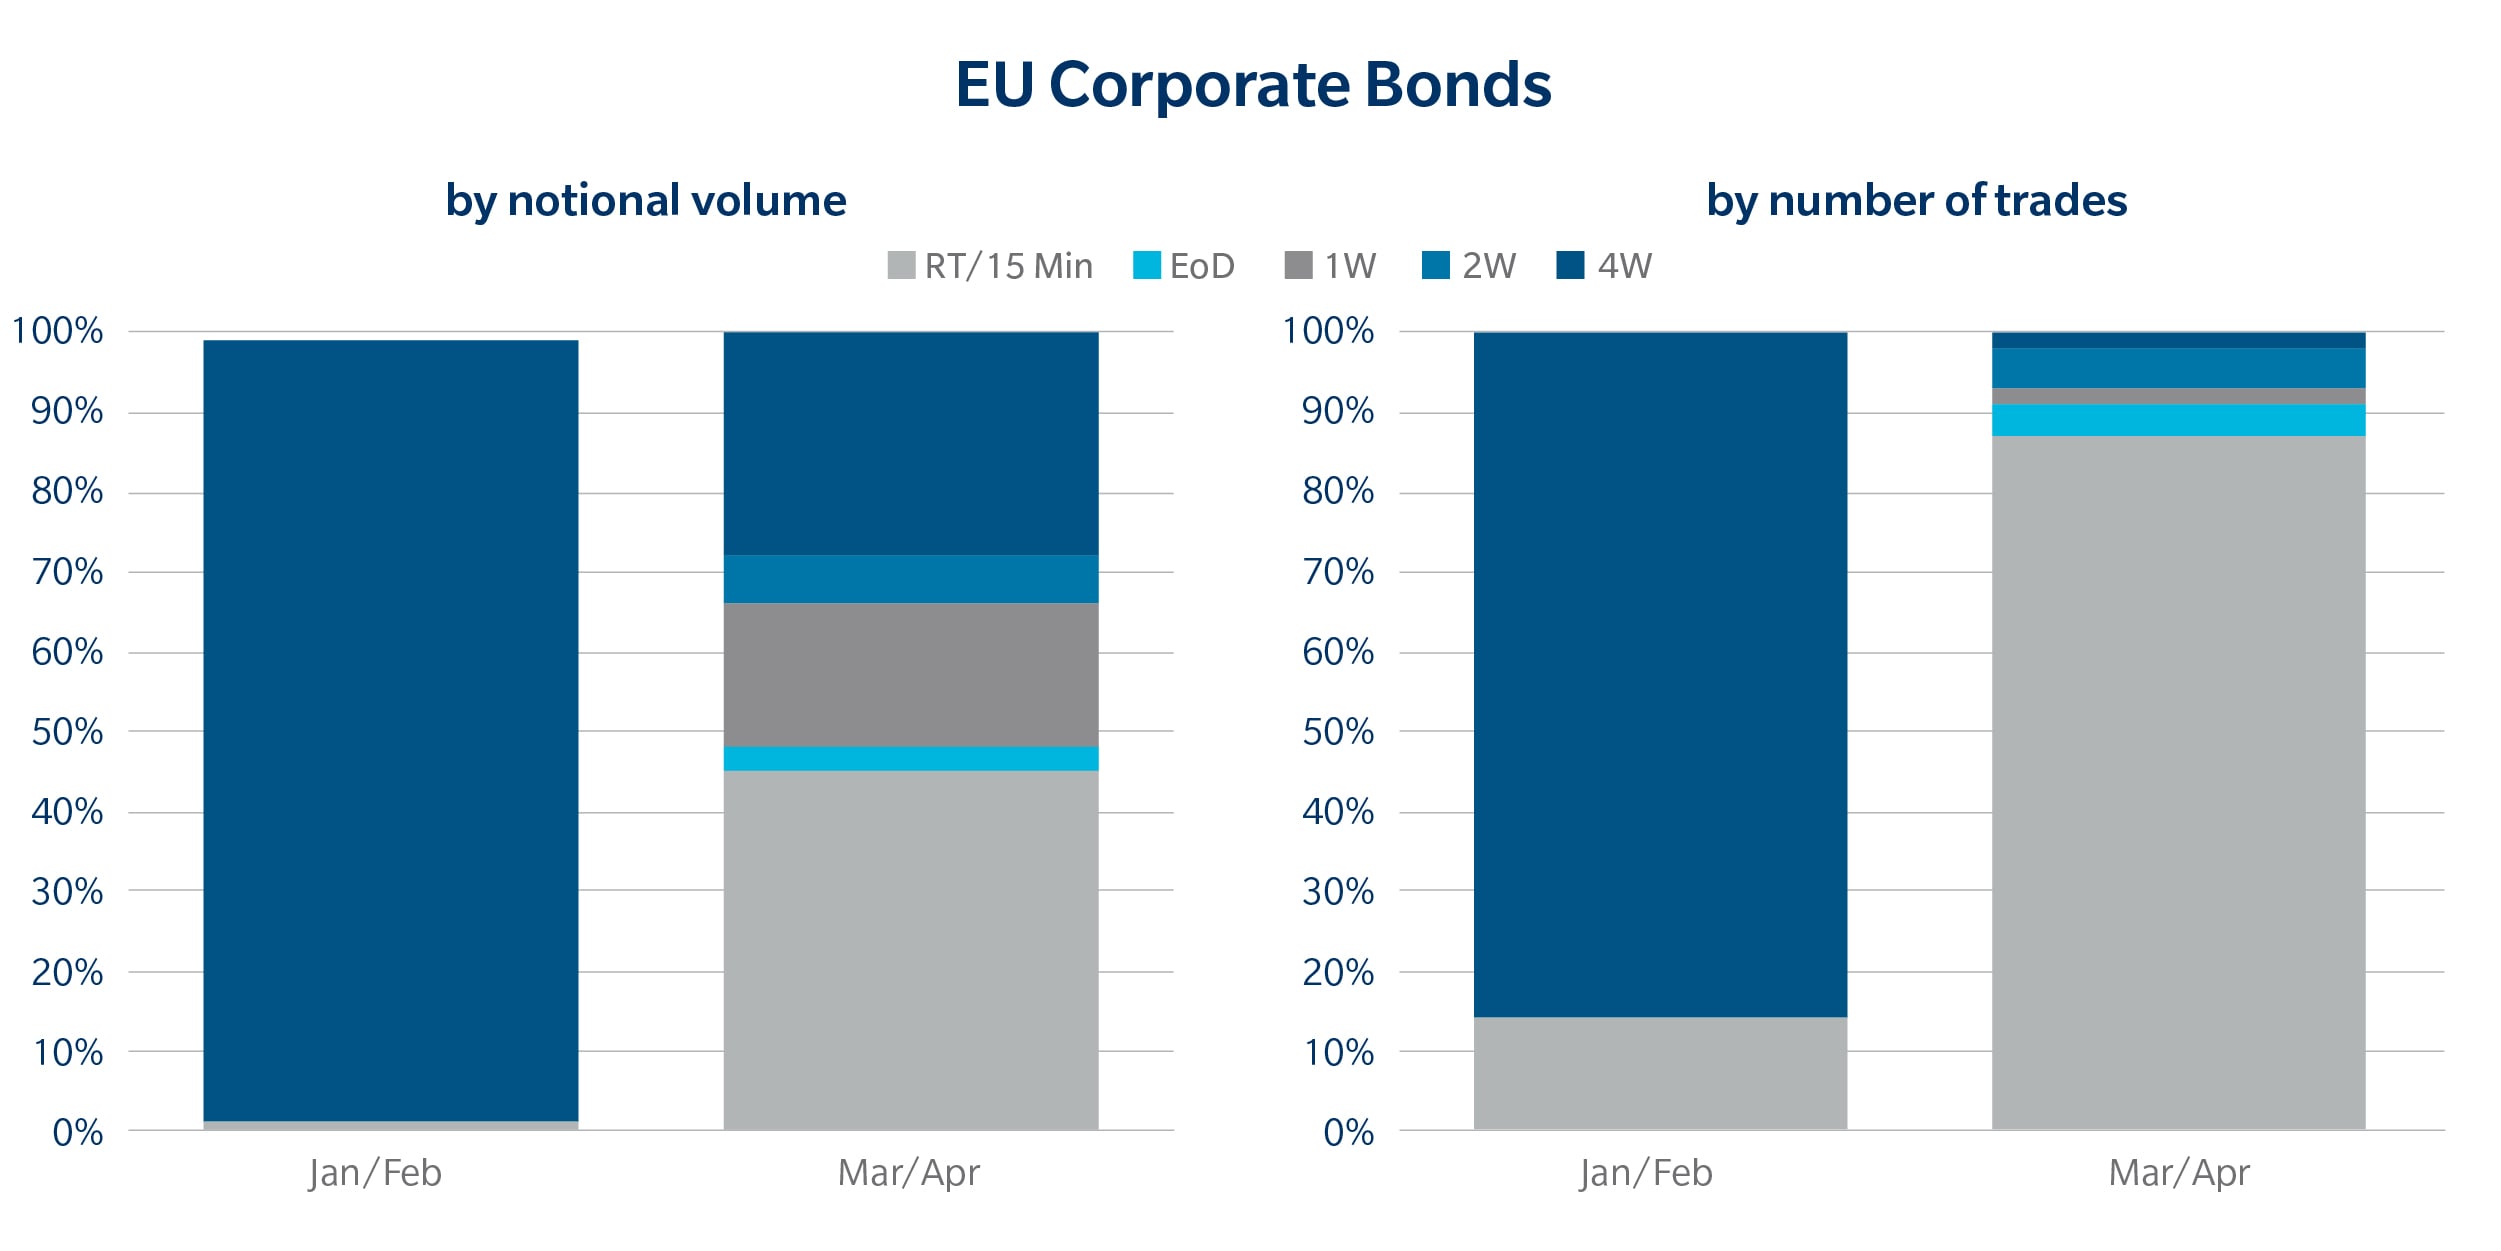
EU Corporate. EU corporate bond publication timing.
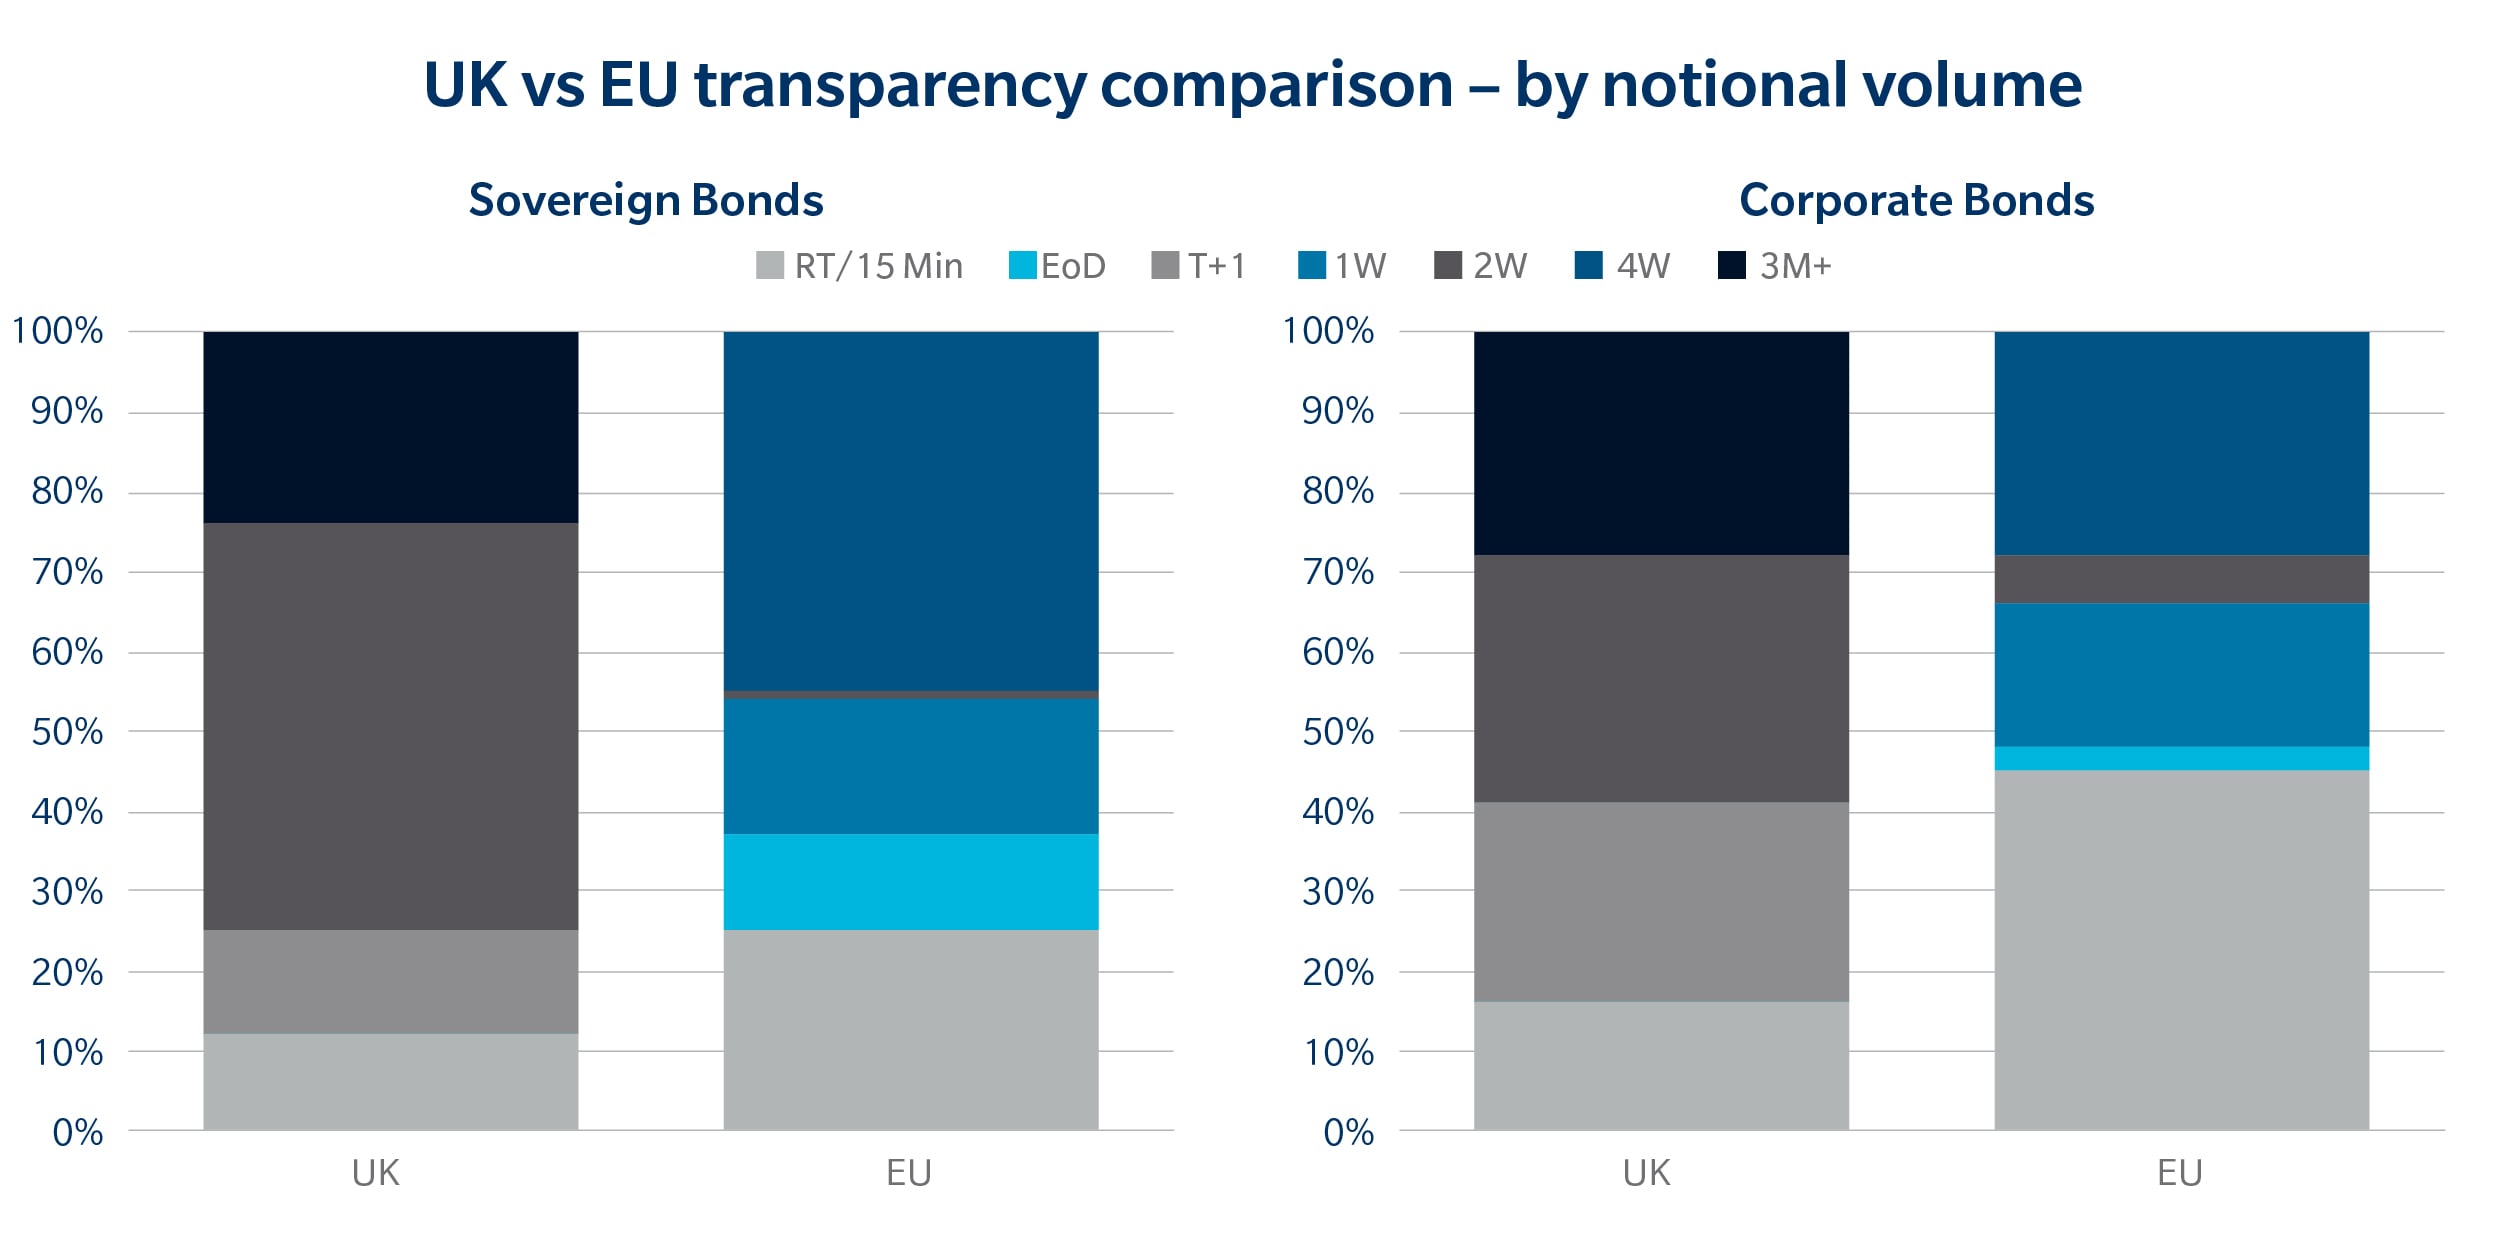
UK versus EU: the answer seems clear
The EU delivers more immediate visibility. In Sovereign Bonds it is a continued theme: more instruments were considered ‘liquid’ under the previous European framework. For corporate bonds, the EU delivers a significant amount of volume dissemination on trade date. However, by T+1 both regimes have ca. 90% of trades and almost half of the executed notional volume published.
The UK has adopted a more linear model, while the EU retains a more granular deferral structure. The result is more transparency, but not necessarily a single view of transparency.
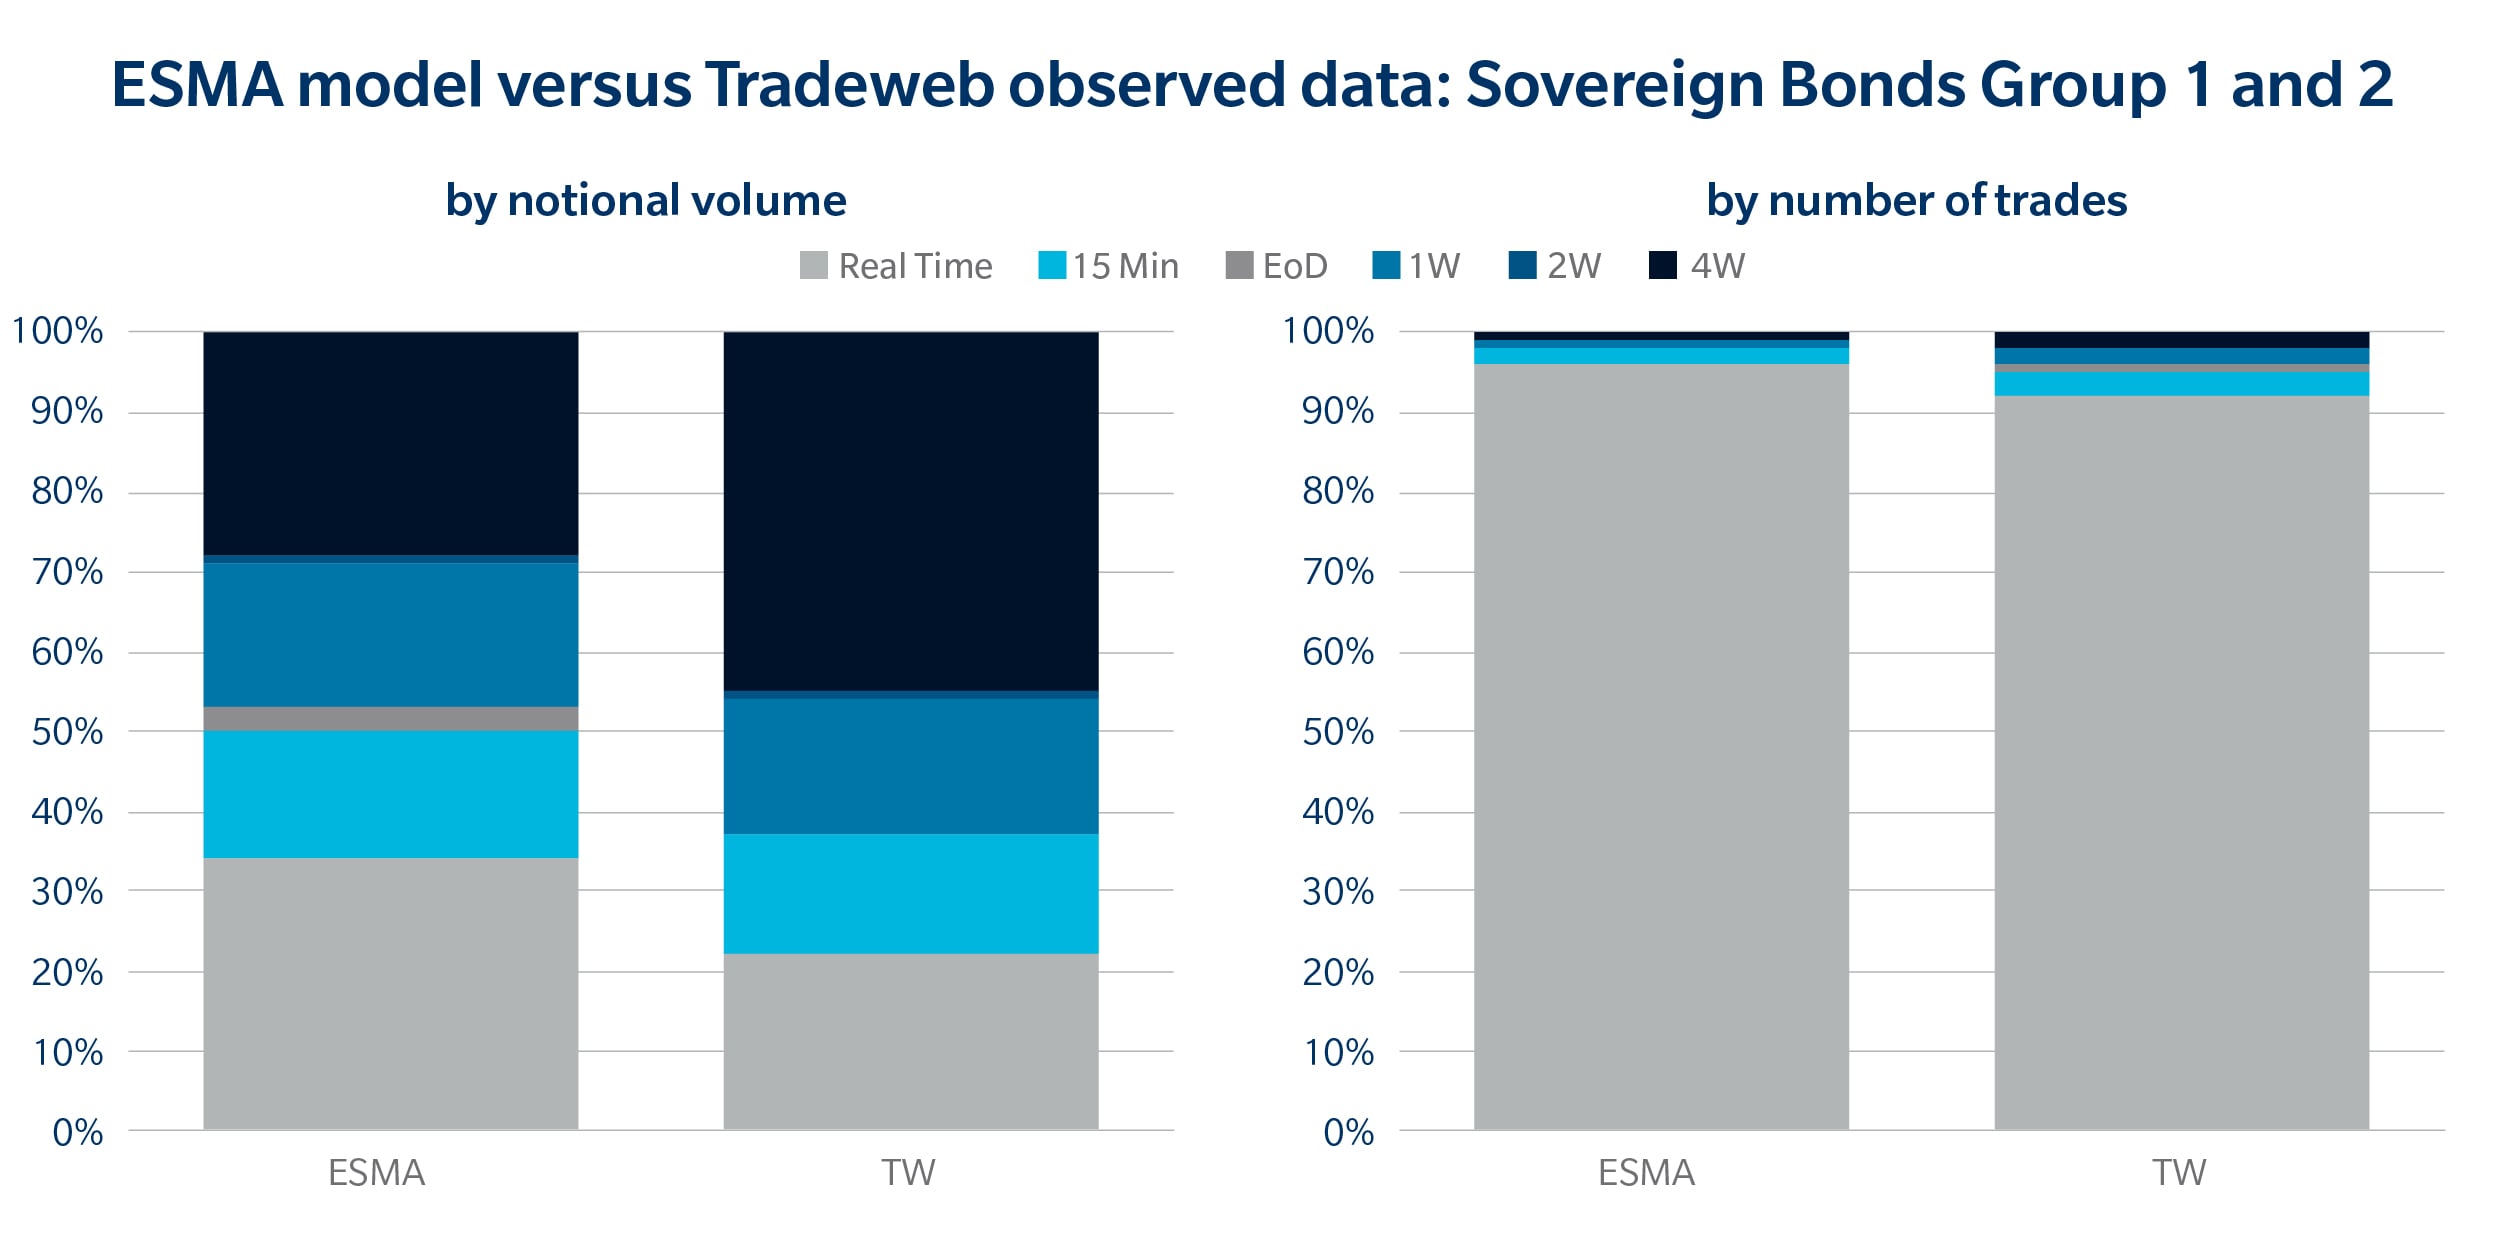
ESMA Sovereign. ESMA and Tradeweb sovereign bond timing comparison.
The x-factor
Percentages tell part of the story. Multiples tell it better.
In some areas, especially corporate bonds, transparency has increased by double-digit multiples. The market has not simply nudged a few trades into a faster publication bucket. In several cases, visibility has changed by an order of magnitude.
That is a big market structure shift, even if the market has not fully reacted to it yet.
The factor by which real-time / 15 min transparency has increased after regime change:
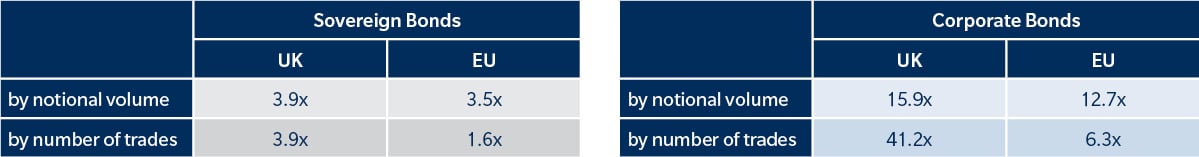
Factors tables. Real-time factors for UK vs EU sovereign bonds and corporate bonds.
But visibility is not moving uniformly across the market. ESMA modelled the expected impact of the new regime, and early Tradeweb data suggests that observed publication patterns are not always as immediate as anticipated. In particular, large trade size buckets continue to play an important role, with a meaningful share of sovereign and corporate bond volumes still protected for one or two weeks.
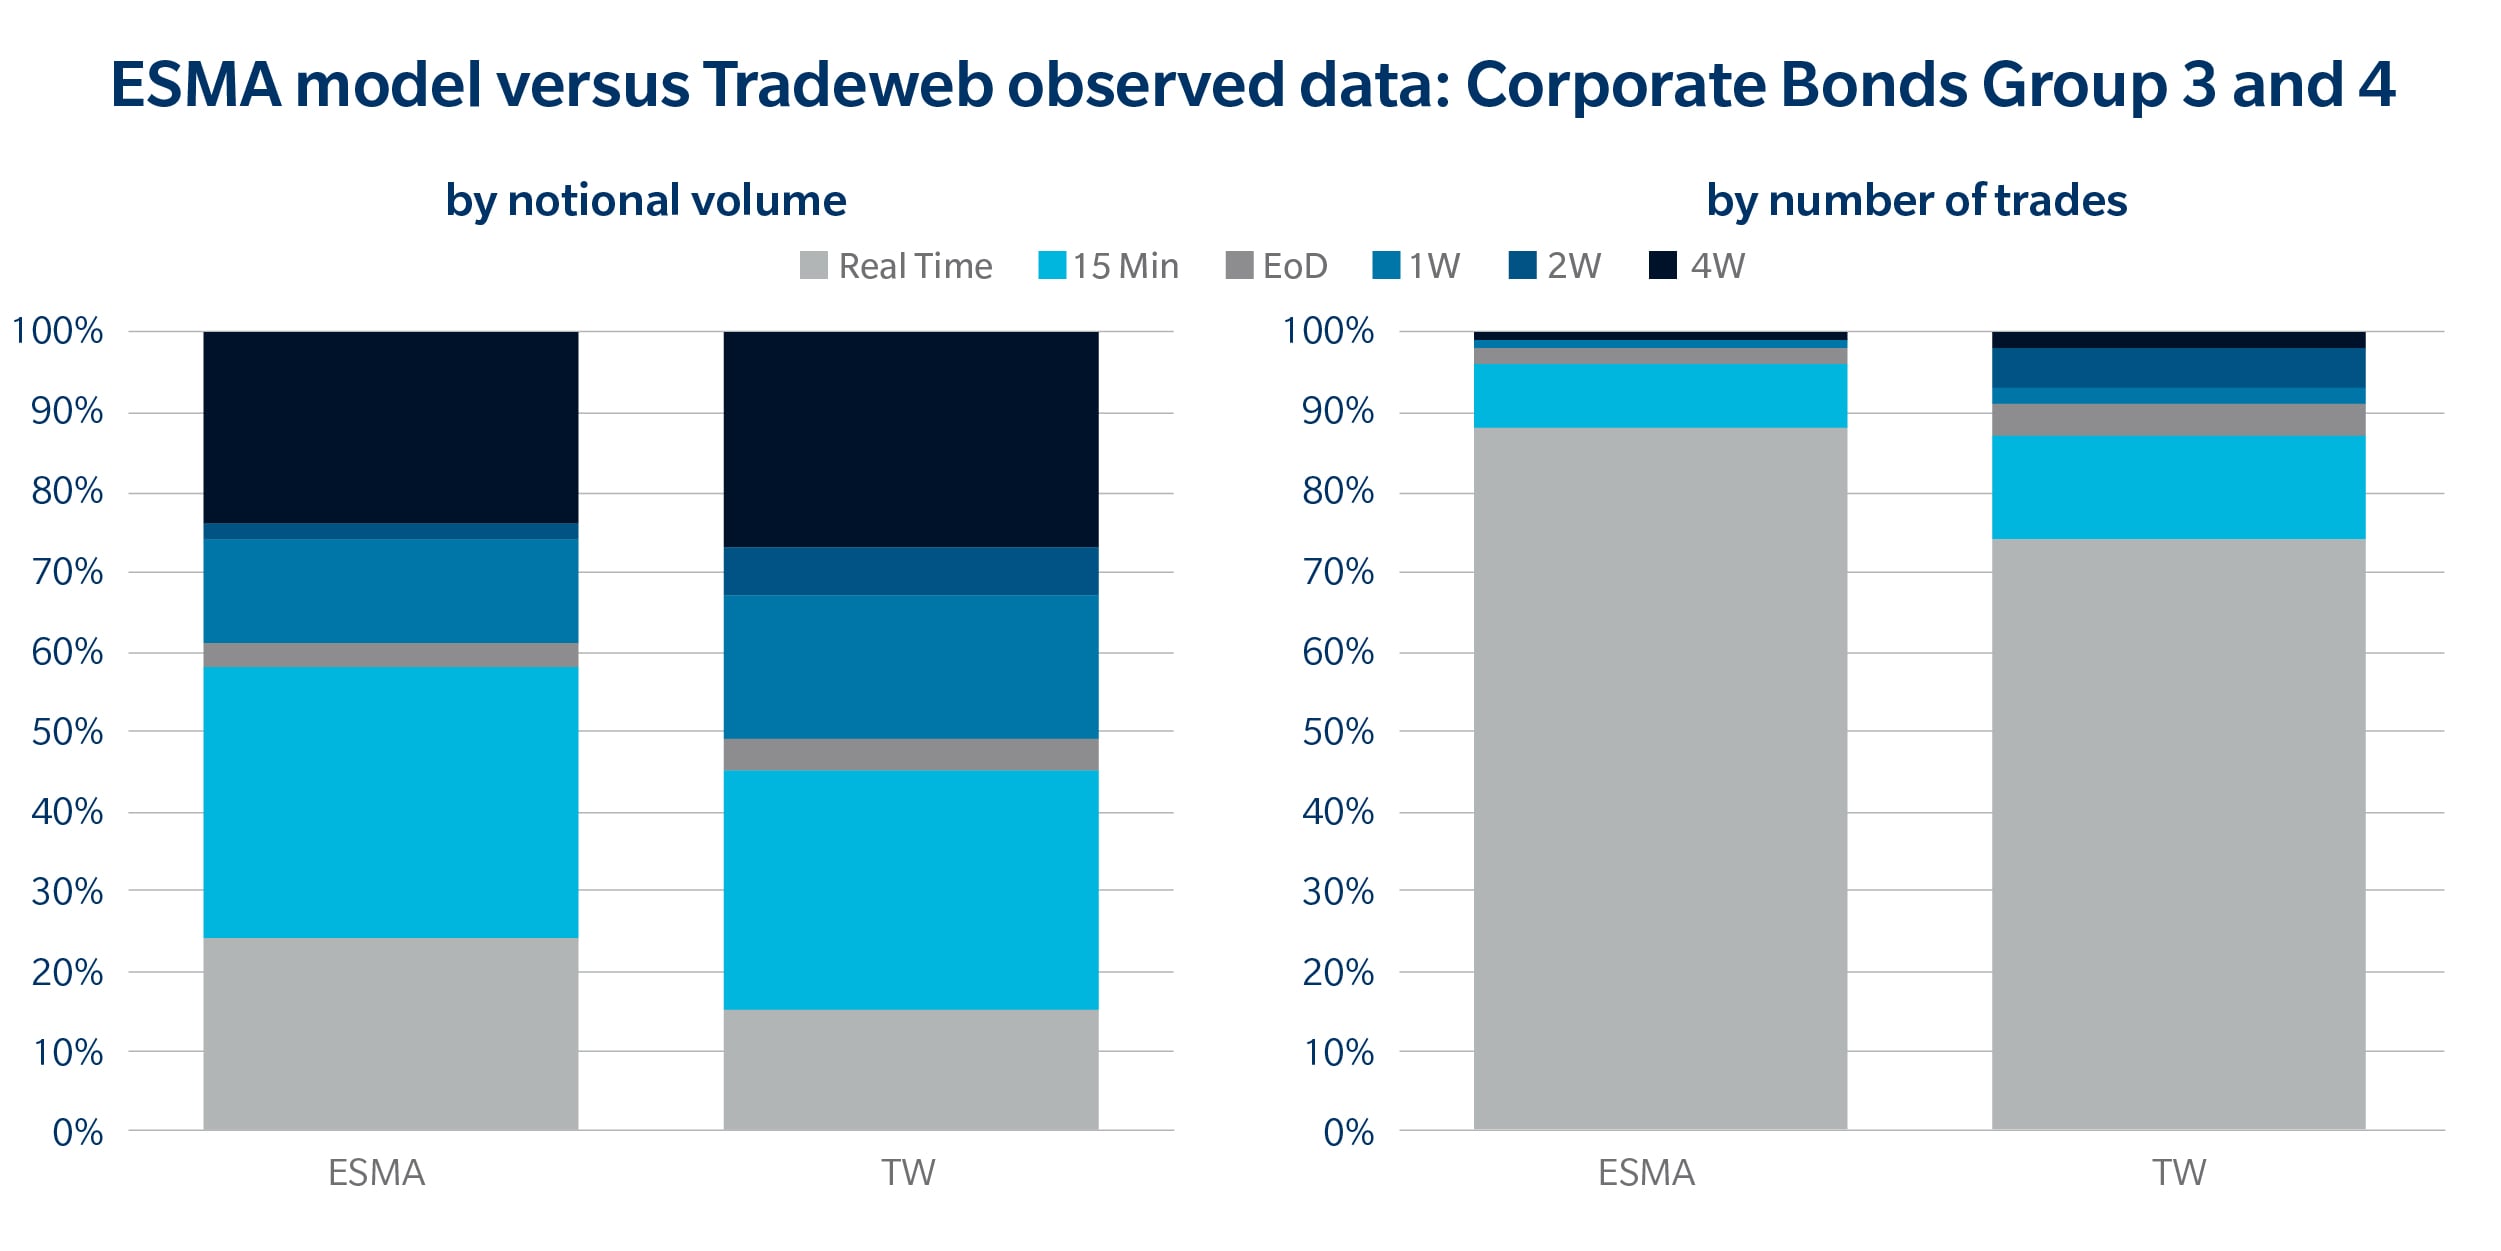
ESMA Corporate. ESMA and Tradeweb corporate bond timing comparison.
UK vs EU. UK and EU bond publication timing comparison.
What has not changed yet?
Data is more visible, but it is still too fragmented.
Published across venues and APAs, it follows different UK and EU deferral rules, and it is not always easy to aggregate. Many firms are not yet consuming it systematically, and some are waiting for official tape infrastructure before investing more heavily in analytics.
There is also a behavioural lag. Fixed income markets do not change overnight. Traders, dealers and investors need time to understand whether new data is reliable, useful and worth embedding into daily workflow.
That is why the launch of the UK bond Consolidated Tape matters.
The tape changes the question
A consolidated tape should make it easier to aggregate post-trade data and create a more complete view of market activity. That could support better pre-trade context, stronger liquidity analysis, more consistent benchmarking and more informed execution decisions.
It may also start to influence behaviour. If market participants can see more, compare more and measure more, they may begin to trade differently.
That is when transparency reform becomes more than a regulatory change – it becomes a workflow change.
What to watch next
The first phase of reform changed how much of the market is visible. The second will test whether that visibility can become insight.
More data is now available. The harder question is what the market will do with it.
The charts above summarise the key shifts in publication timing. For readers who want to see the underlying figures, the tables below set out the same (simplified) data in percentage terms, by notional volume and number of trades.
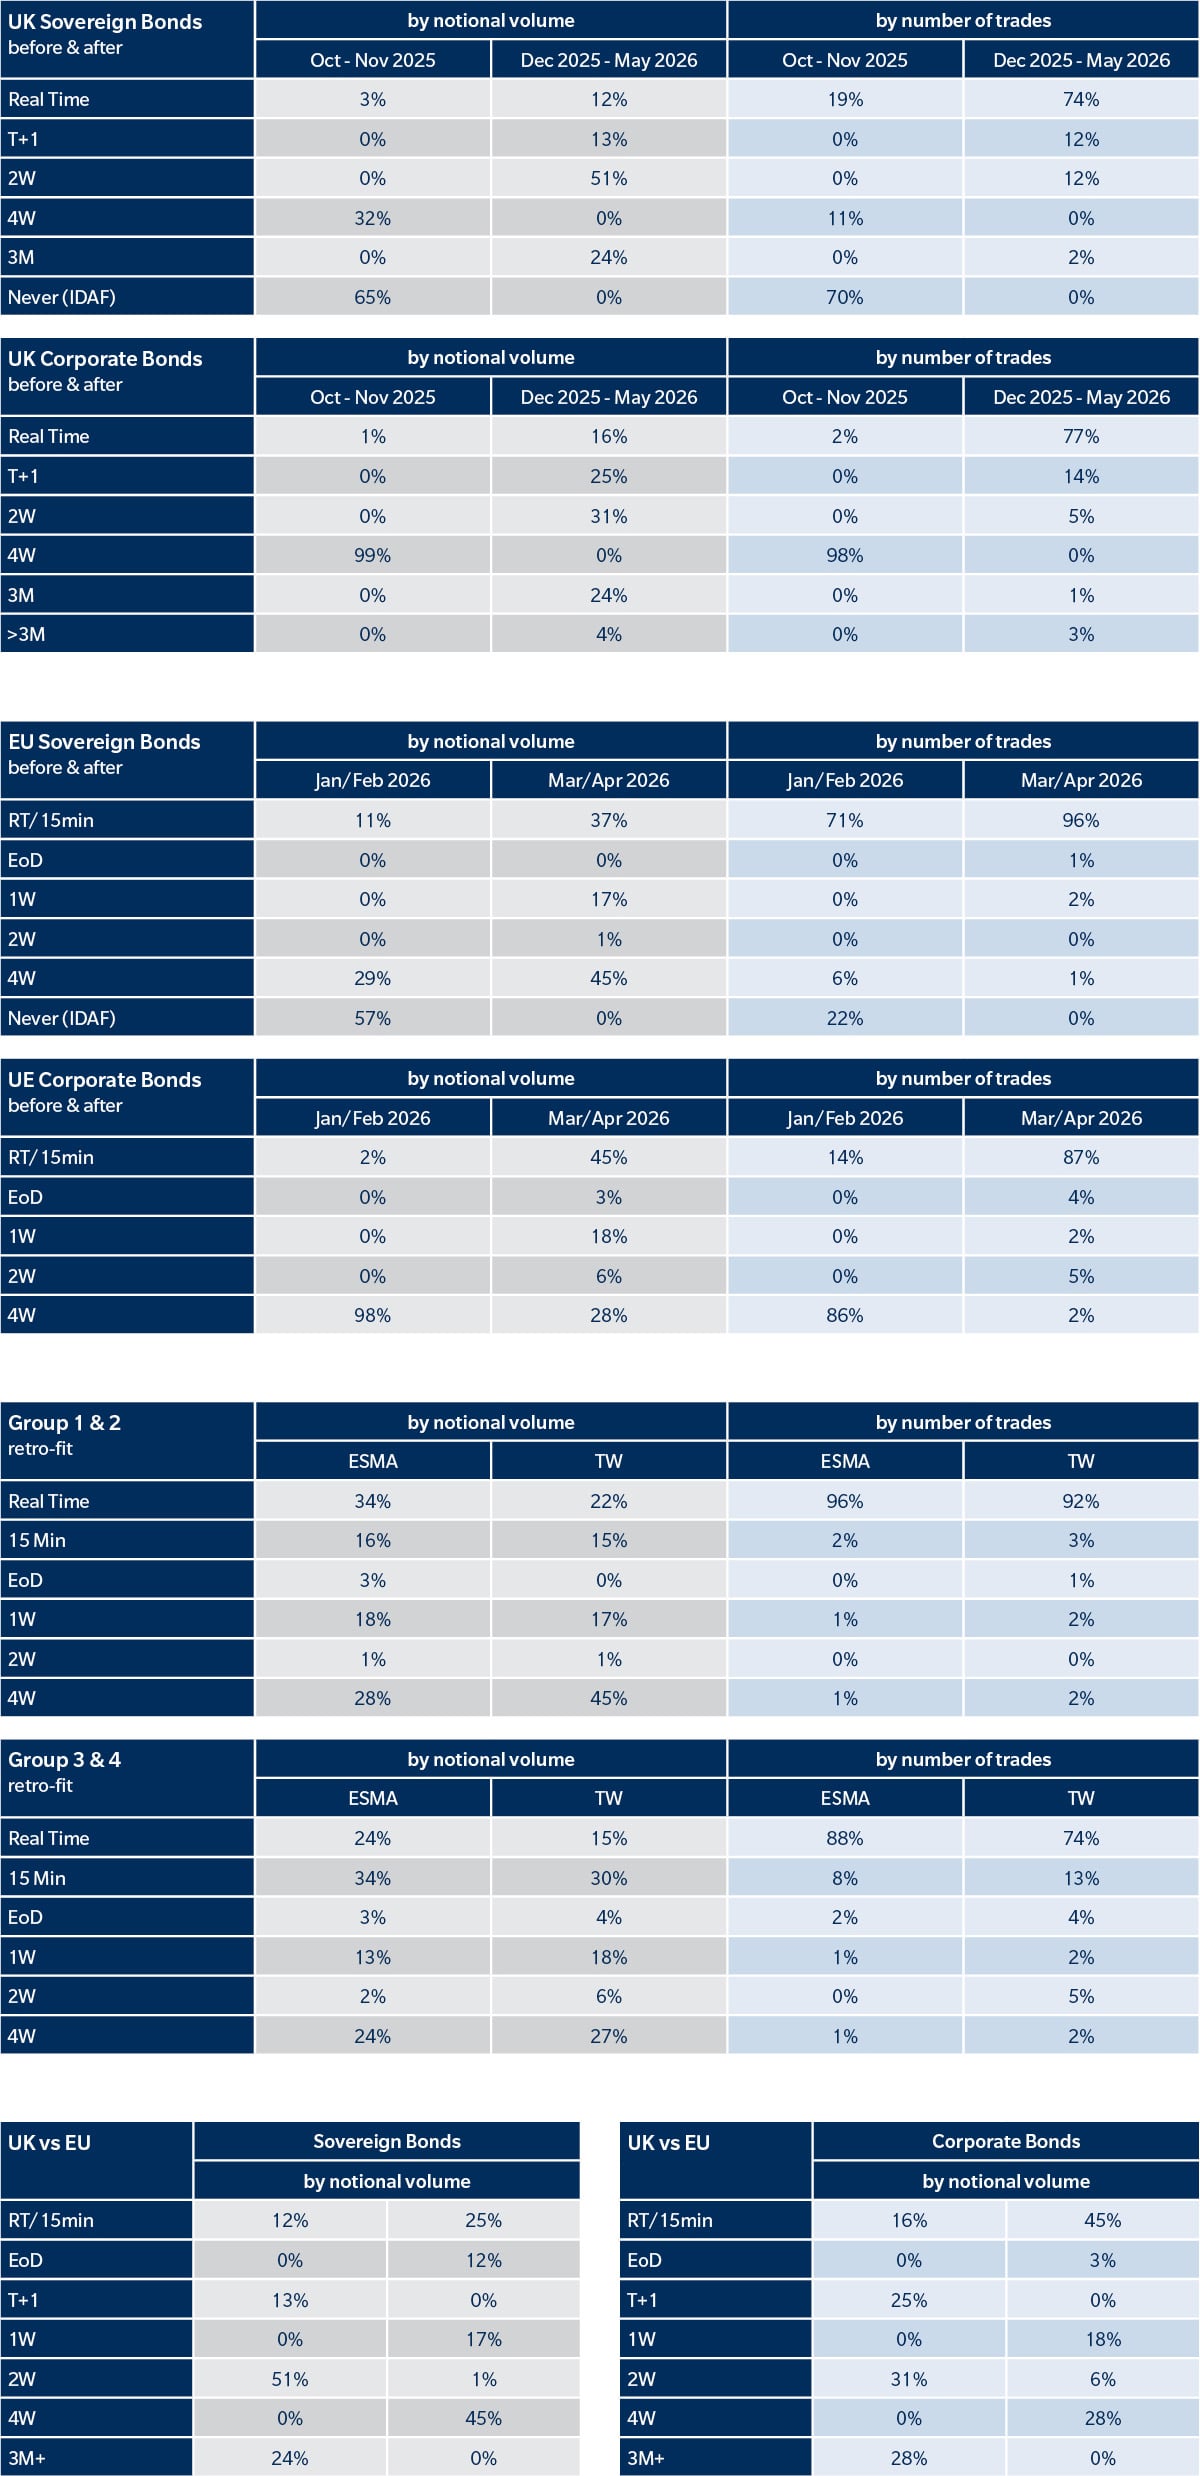
Full tables. UK and EU bond publication timing tables.