

Bitcoin continues to weave around the $60,000 mark, looking at the performance in the daily chart. Even though buyers are optimistic, the indecision seen explains the drop in engagement over the past few trading days. Considering the current state of affairs, traders are closely watching how prices will turn out in the coming days aware that any close above $63,000 will be critical in cementing their expectations. Beyond price action, traders are looking at the evolution of inflows into spot ETFs. In H1 2024, they were key in driving demand.
The sideways chop of the past few trading days shows in the general performance. As it is, traders are confident, but Bitcoin is flat. The region of support is between the $57,000 and $60,000 zone, while any breach of mid-August highs will signal trend continuation. Before then, the average trading volume is low, at just $20 billion.
Amid this state of affairs, prices are steady, but traders are watching the following trending Bitcoin news:
- The sideways movement of Bitcoin is amid a spike in stablecoins. According to trackers, over $2 billion of USDT and USDC were minted in the last eight days. Usually, whenever there is inflow of stablecoins, it precedes a surge in pricing.
- Bitcoin remains flat, but BlackRock, a spot ETF issuer, now holds more coins than Grayscale’s GBTC. This means that though GBTC is losing clients, more of them seem to be finding their way to the world’s largest asset manager.
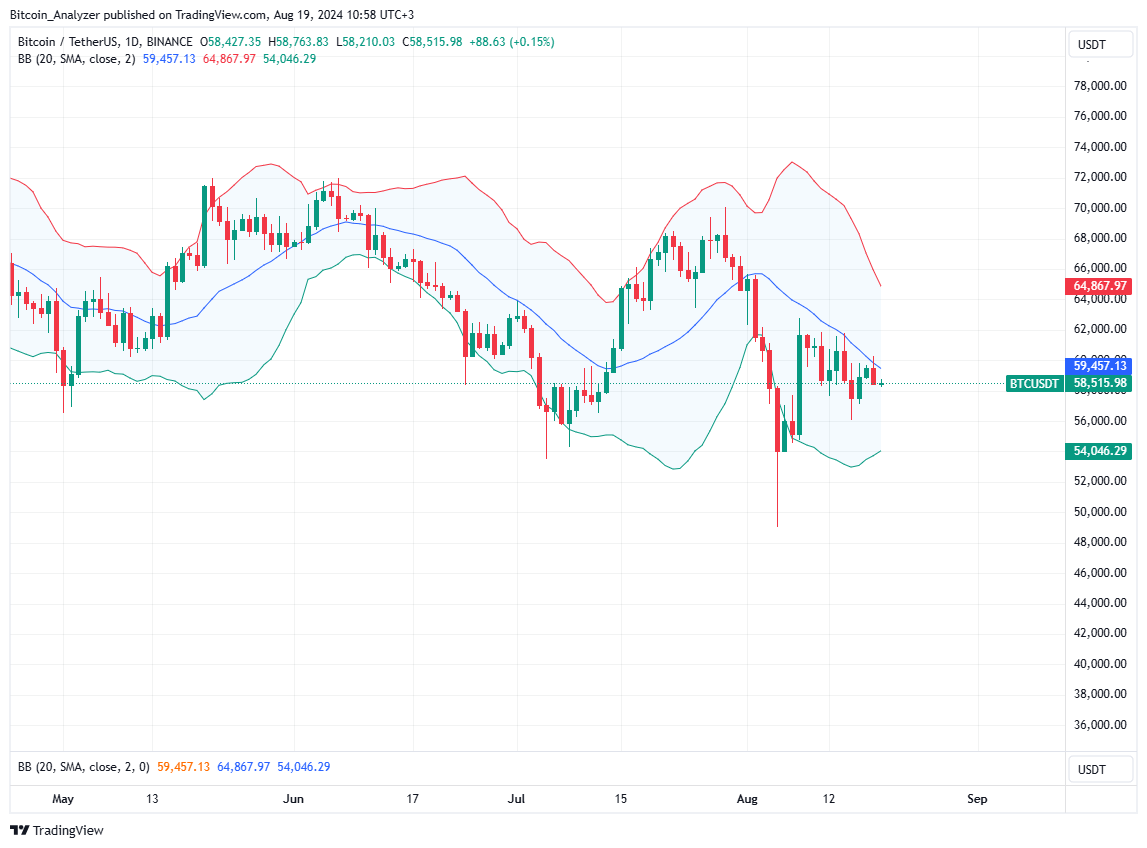
Bitcoin Price Analysis
BTC/USD is firm at spot rates, looking at the development in the daily chart.
Technically, buyers are confident.
However, before conservative traders get in, there must be a close above $63,000. If there is a surge above $72,000, that will be better.
Aggressive traders, on the other hand, can buy the dip above $56,500 or June and May lows, targeting $63,000 and higher.
Even so, should Bitcoin slip from spot rates, dumping below $56,500, it may crash to $50,000. In that case, BTC may slip to $40,000 in a bear trend continuation formation.